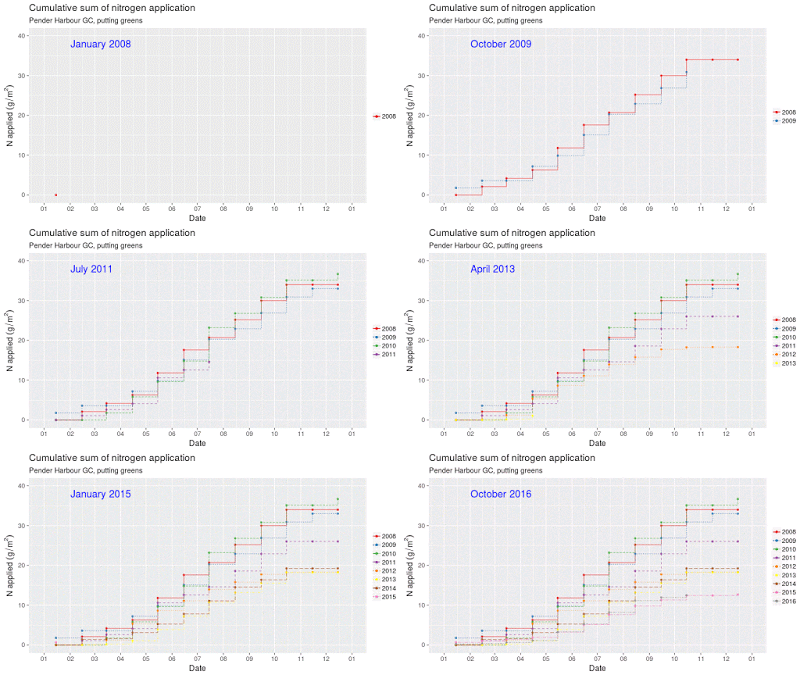
Those are the results Jason Haines described in his post about the evolution of precision fertilizer application. He explains how he makes use of observations, measurements, and predictions to find site specific nutrient requirements.
It’s a good read, and it has this animated chart that shows how N rates have decreased over the past few years.
