A correspondent wrote with these inquiries:
“I am curious about your stance on nutrients in irrigation water. For example let’s say the irrigation source has 60.6 PPM or 13.76 lb/A/in Calcium.
Would you consider irrigation cycles in your nutrient totals for the year? Is it correct to assume that 10 cycles of .25” of water would contribute 1.25 lbs/M of calcium to the soil? Would that pose any problems to a soil that falls well above MLSN guidelines for Calcium content?
Even low levels of potassium, magnesium, etc? Do you find that these nutrients contribute anything to the soil? Is this over analyzing?”
This was my response:
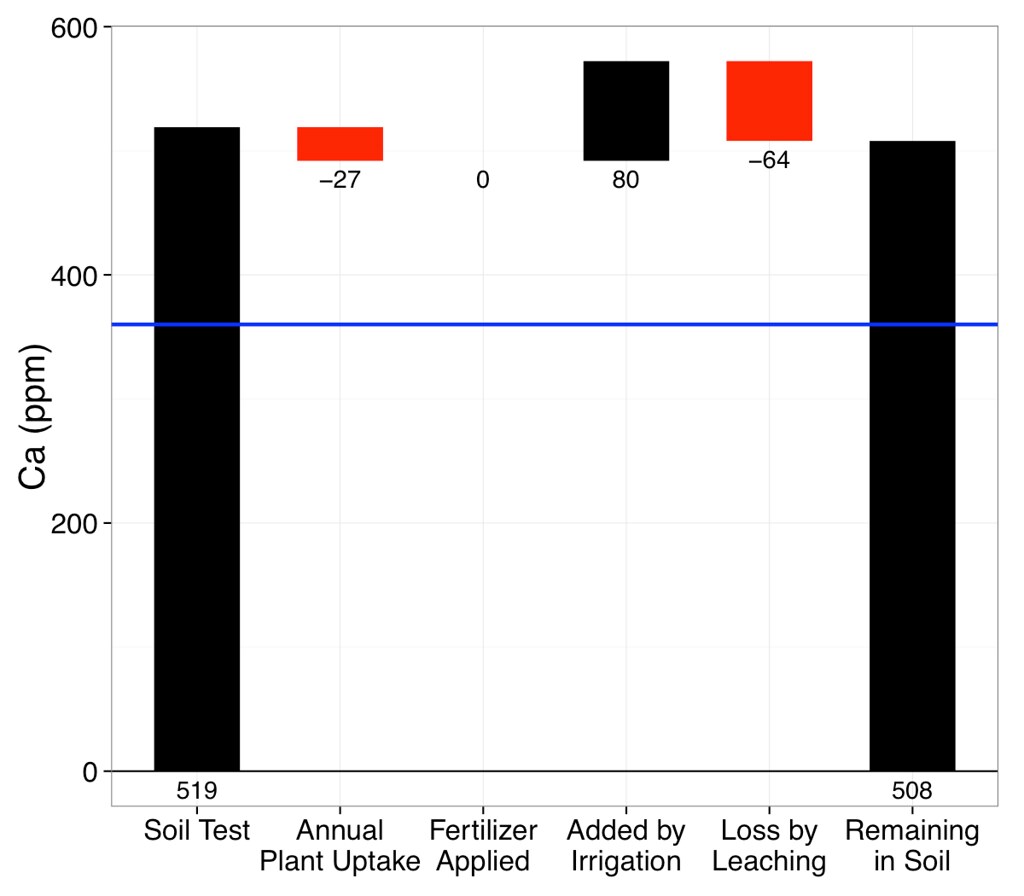
That’s a good question. In general, I am aware of nutrient supply from irrigation in the back of my mind, but don’t usually add it to calculations because I assume that leaching will generally be pretty close in quantity to the amount supplied as irrigation. Adding Ca in irrigation doesn’t add any more CEC for the soil to hold Ca, for example, so one can expect over the long term that the Ca will leach.
I calculate 10 cycles of .25” of water with that much Ca in it would add about 0.8 lbs Ca/1000. I don’t think that poses any problems. In general, these additions of nutrients through the irrigation water are a positive. I think of them as some extra nutrient supply.
I don’t think this is over analyzing. One can calculate these amounts and adjust fertilizer inputs accordingly, if one wants to. I think in most cases one can be aware of this, make some quick calculations to keep in the back of one’s mind, and then ignore the irrigation nutrient supply, for two reasons:
- the aforementioned probability of leaching
- the assumed annual soil testing, in which one can see if Ca went up or down, if Mg went up or down, K went up or down, etc., compared to the soil testing 12 months previously. From this check of whether the nutrient went up or down, vs. where one would have expected the nutrient to be given the amount of irrigation and fertilizer applied, one can get an idea of what actually is happening, and then make necessary adjustments for the upcoming year.
Please have a look at these blog posts about waterfall charts too. These explain more about these quantities of nutrients.
Using waterfall charts to look at soil nutrient levels: potassium as an example