I was wondering when it usually rains in Bangkok. My usual quick source for temperature, precipitation, and sunshine data is the extraordinarily useful “Climatological Information of World Cities for Travellers” from the Hong Kong Observatory. This is a clickable map-based interface to the World Meteorological Organization’s climatological normals dataset.
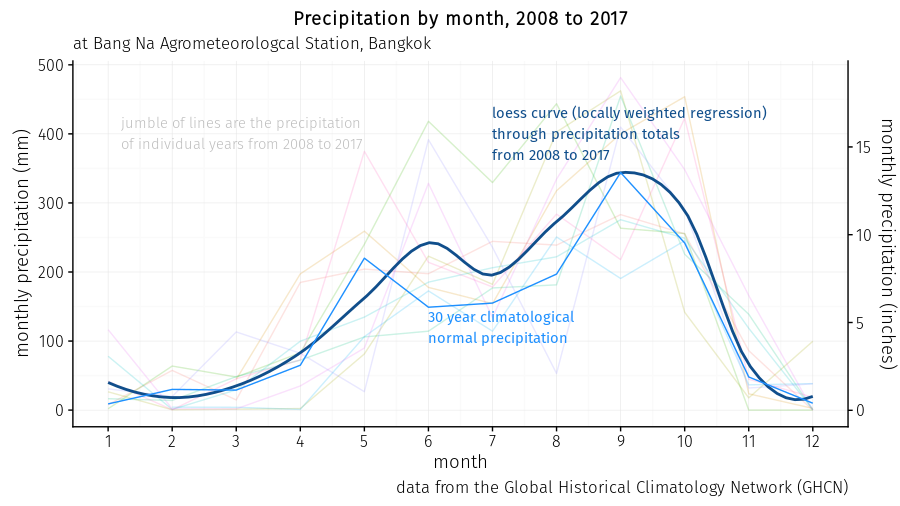
The climatological normals for Bangkok show that there is a six month dry season from November to April, in which the average precipitation in each month is less than 100 mm (4 inches). In fact, the average is less than 50 mm (2 inches) from November to March, and April – which coincides with the Songkran “water” Festival – is the only month in the dry season with more than 50 mm on average. Then from May to October, there are more than 100 mm of precipitation on average each month. May and October both have more than 200 mm (8 inches) on average, and September is the wettest month, with an average of 344 mm of rain (13.5 inches).
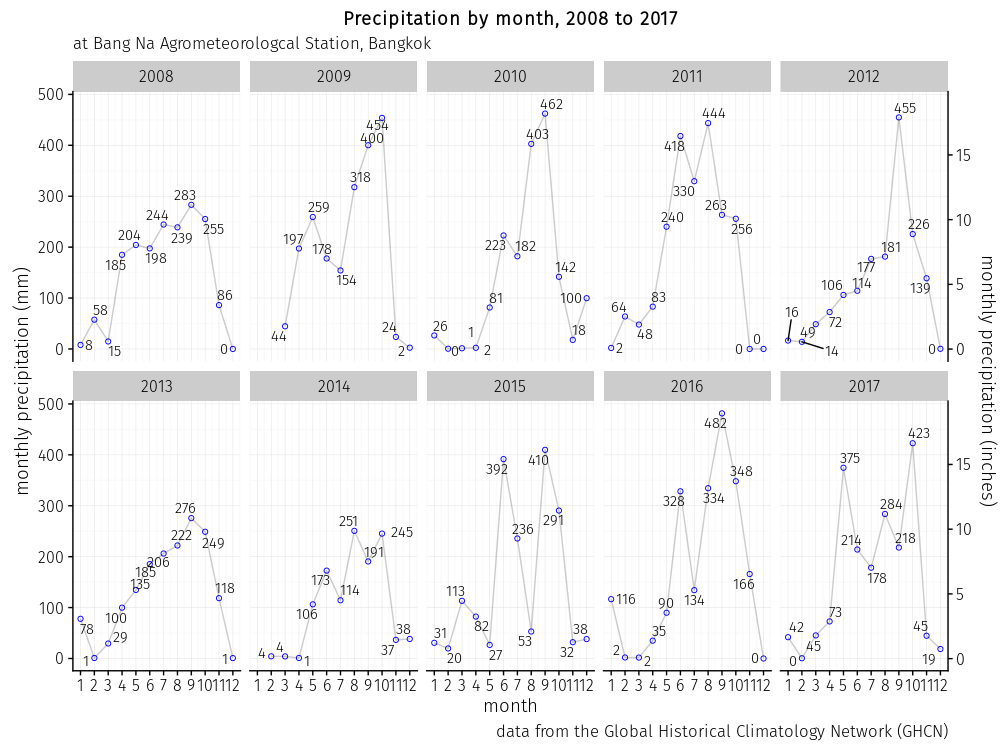
The rnoaa R package from rOpenSci provides an easy way to obtain temperature and precipitation data from the Global Historical Climatology Network. I wondered how much (and when) it has been raining in Bangkok, and today I downloaded the data from the Bang Na Agromteorological Station from 2008 through 2017.
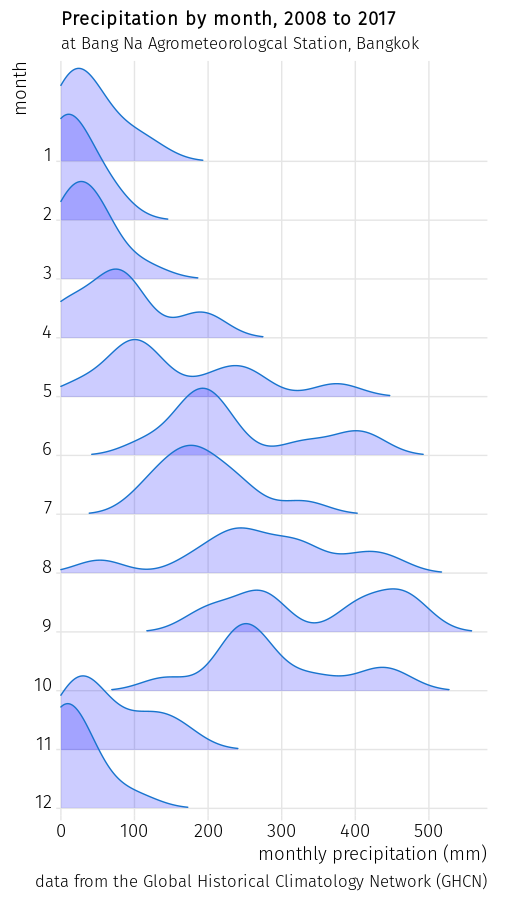
Then I calculated the monthly totals. These are three representations of the results.


This isn’t a forecast, but it is how much and when the rain typically falls at this location.
Technical note: I was having a problem getting the data with an error message about “expecting an integer.” I’d been having that problem for a few months, and I was pleased to find the solution. I solved it with ghcnd_clear_cache(force = TRUE) as explained here.