In this post I’ve got something new and something old.
Something new
First, the new. I am going to start using a standard unit of mL/m2 to express the clipping volume. This is milliliters per square meter. I have previously used units of L/100 m2. This is an easy change to make. 1 L/100 m2 is 10 mL/m2.
Why the change? Because this gives a number for almost all measurements that will be between 0 and 100. Vigorously growing turf may be from 20 to 50 mL/m2. Haven’t mown for a few days? You may get more than 50 mL/m2. Under tournament conditions, one might have less than 10 mL/m2 from a double cut of the surfaces. Using a unit on a scale from 0 to 100 is easier because it avoids decimal points. And it expresses the volume per square meter, which is the base area unit I prefer.
When I was in graduate school, I read a paper by John Monteith—you’ll recognize that name from the “Penman-Monteith” equation for evapotranspiration—entitled Consistency and convenience in the choice of units for agricultural science. Here’s his advice:
“How should an appropriate multiple or sub-multiple of a unit be chosen? When repeated measurements of a quantity are to be reported, it is worth looking carefully for a unit which will avoid the frequent quotation of unnecessary zeros or decimal points. For example, the mean weight of a cereal grain should obviously be reported as 38.2 mg rather than 0.0382 g or 38200 μg. In general, when a quantity is quoted to two or more significant figures, the choice of unit should preferably allow its numerical component to fall between 1 and 100; but when only one significant figure is available, it should normally lie between 1 and 10.”
I try to work with units that fall in that range, and I intend to start doing so in my discussion of clipping volume.
Something old
The question of clipping amounts and their relation to green speed comes up frequently. I’ve written about this previously.
In general, the relationship between morning clipping volume and the green speed measured shortly after goes like this. When there are fewer clippings, the green speed is faster.
Of course, one can find plenty of exceptions. Three notable ones are here.
- When one does a double cut, there will be more clippings, and the green speed will also be faster. It might be useful to restrict direct comparisons to days on which the same work is done to the turf.
- When the turf is not mown every day, the speed will usually be faster on the day when it is mown and the clipping volume is > 0. Again, I find it useful to group the comparisons based on the work that was done.
- When the season is different, there will be inherent differences in the green speed that are related to plant morphology in addition to the effect of clipping volume.
This chart with data from 39 days of paired measurements at Keya GC in Fukuoka, Japan, shows all of these exceptions, and it also shows how one can expect clipping volume and green speed to be related.
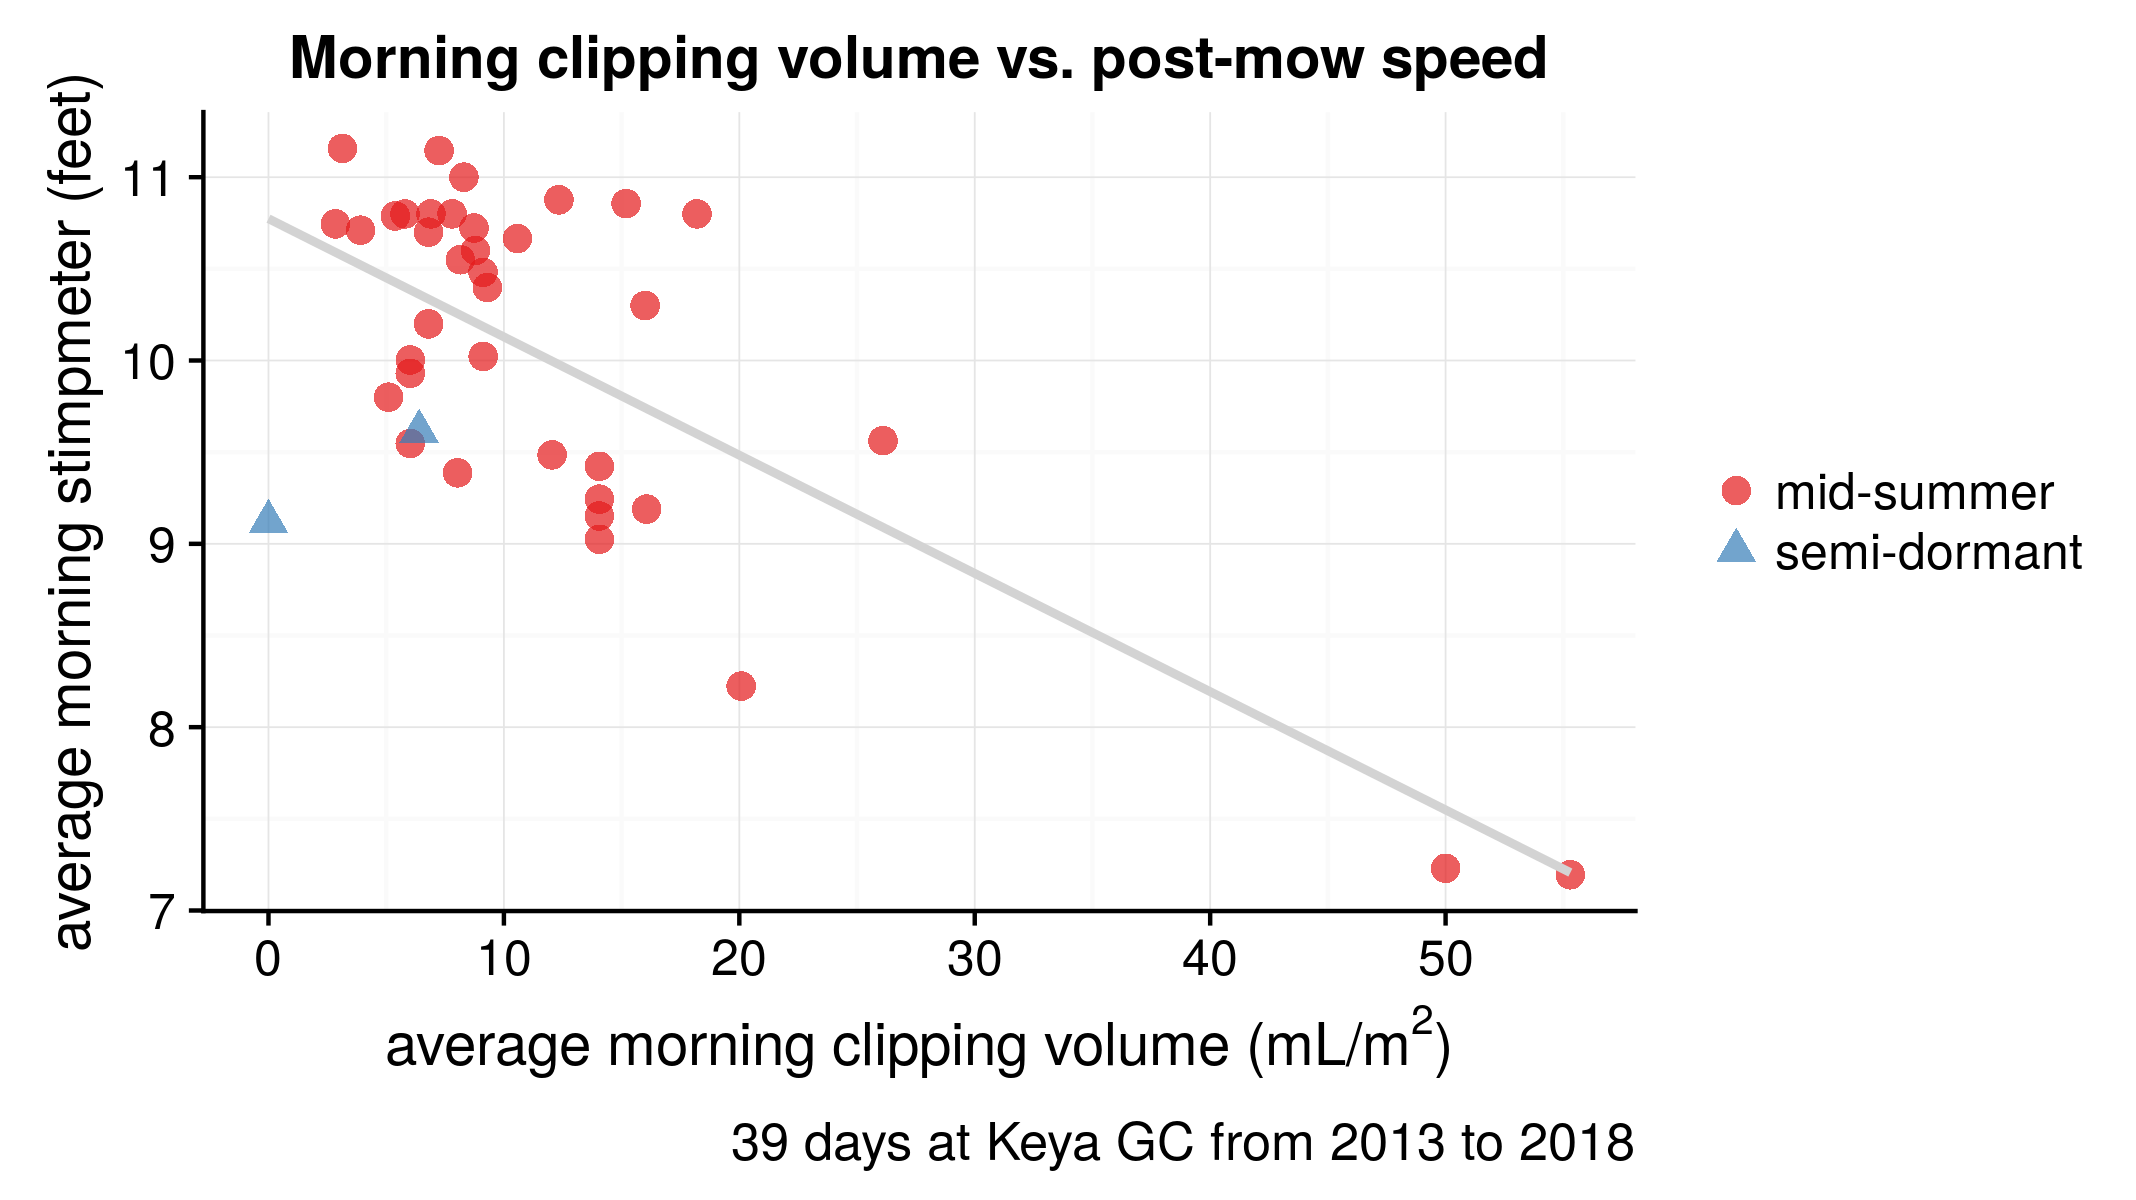
The red circles are labeled “mid-summer.” They are all collected in July and August. Those two days at the bottom right were July 29 and July 31 of 2016, and represent the #ClipVol with a single cut. 50 mL/m2 is a lot of clippings; the grass was growing fast on those days. You can imagine that if another cut had been put on the greens, the clipping volume may have gone up to 70 or 80—and the speed would have gone up too.
The blue triangles are yesterday and today. Yesterday the greens got a single cut and the clipping volume was 6. Today the greens were not mowed; the clipping volume was 0 and the speed was slower than yesterday when the clippings were more.
Over the course of days, months, and seasons, this is what I expect. If one were to do exactly the same work to the turf every day, then the relationship between clipping volume and green speed would be tighter.