This week I’ve thought of a couple things about #ClipVol.
First is the way I think of the data.

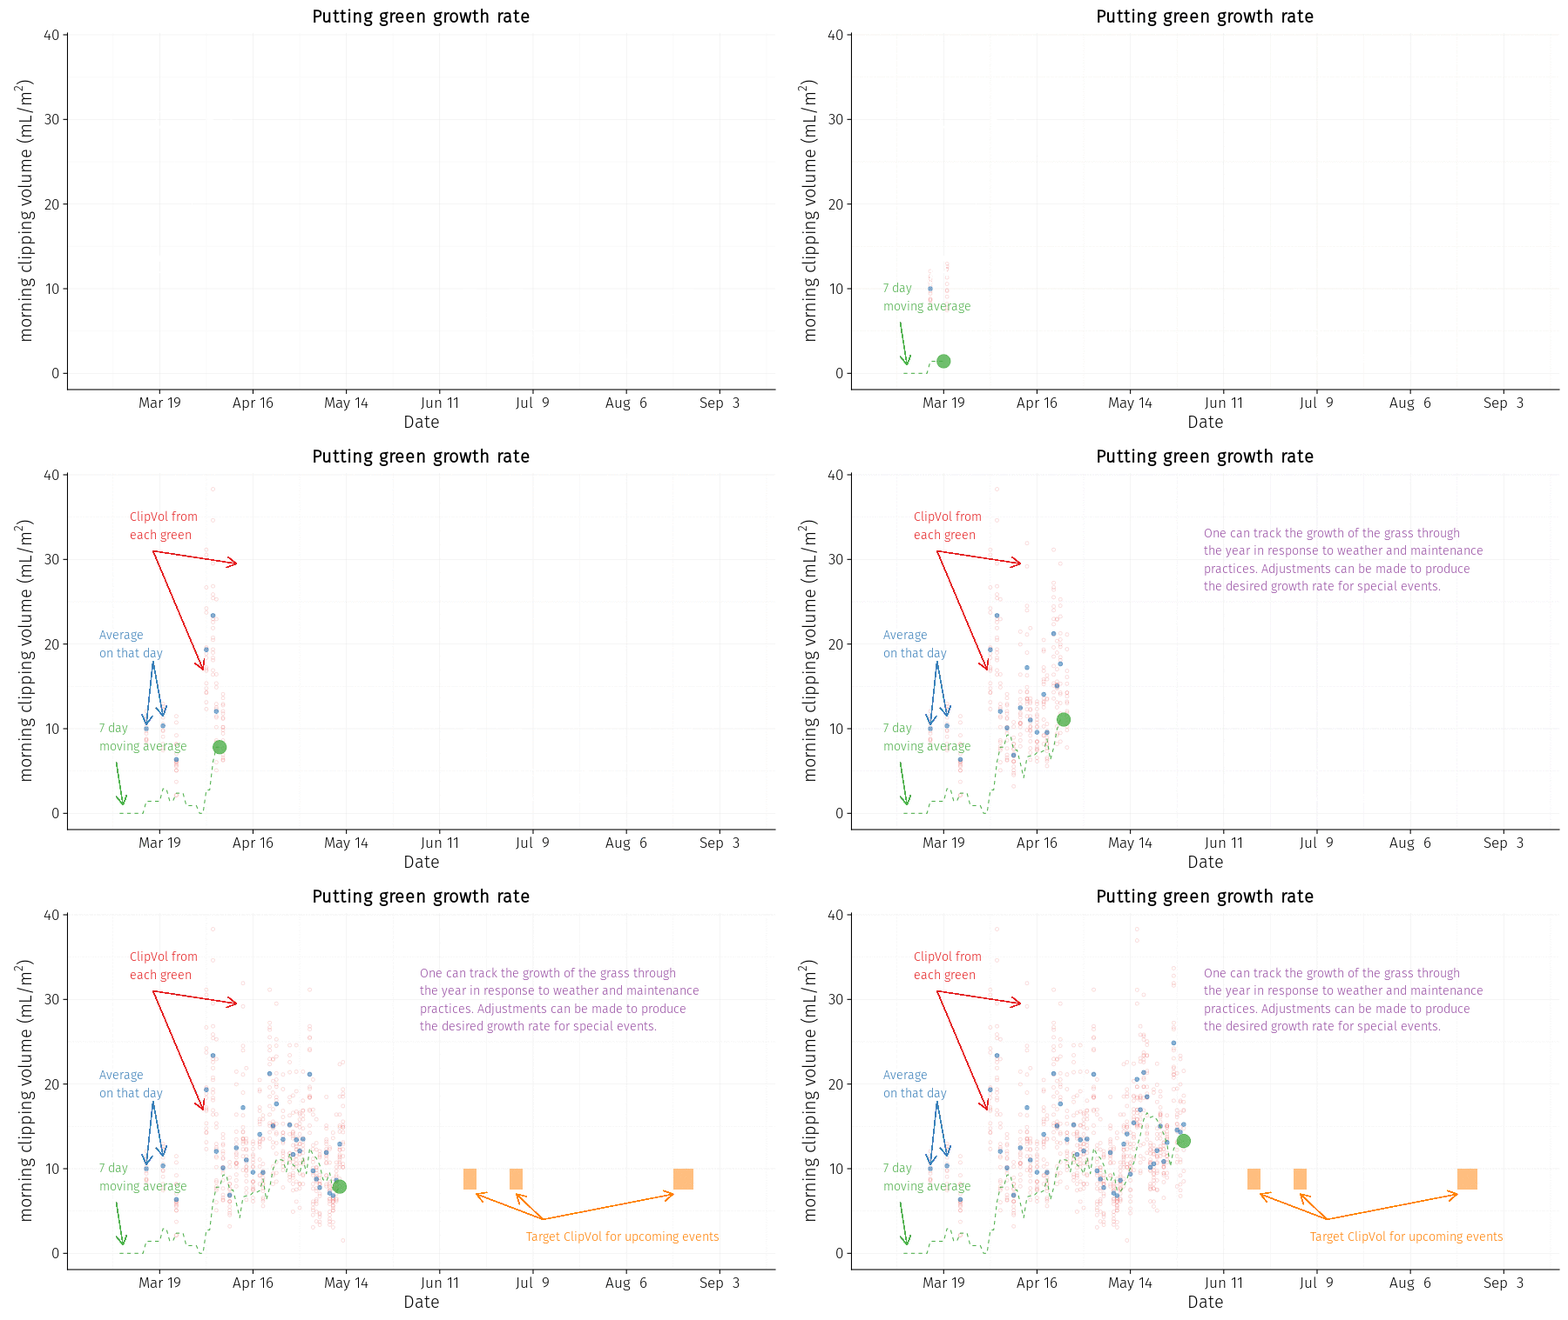
I’ve shared a lot of charts about clipping volume, and as this growing season gets underway in the northern hemisphere, I wondered if I could describe it on an animated chart.
Second, I’ve been most interested in clipping volume as a way to measure how much the grass is growing and how many nutrients the grass is using. Because of that, I want to know the total quantity of clippings removed, and I have reported the data in that way. I know a lot of people like to look at the relationship between clipping volume and green speed too. If one expresses the clipping volume as volume/area/mow, rather than volume/area/day, this relationship may be a little more obvious.
In that way, with a double cut, the volume is reduced by 50%, and of course one expects the speed with a double cut to go up.