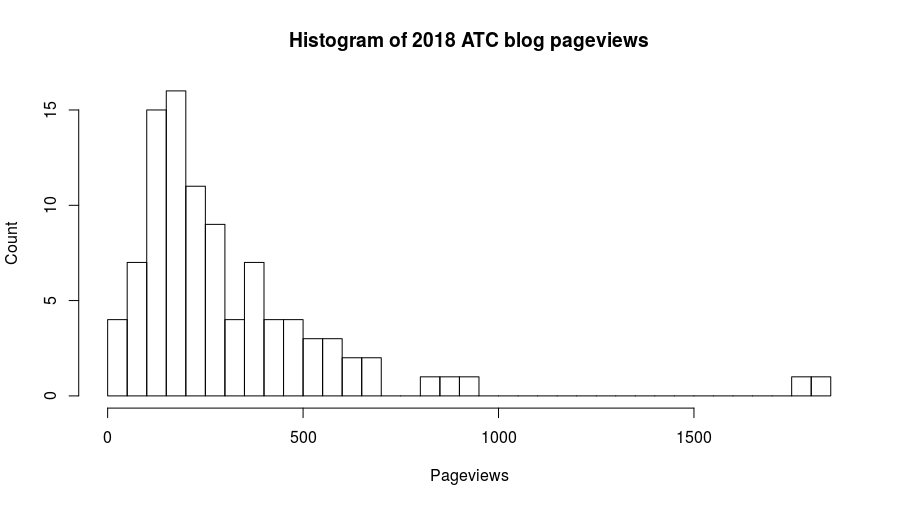
The median blog post on this site in 2018 got 217 views. A couple had more than 1,500.
These were the 10 that everyone read. And then there are these ones that almost no one read.
These 10 posts all had less than 106 views at the end of the year.
Some are obviously of limited interest to the general public, such as those about details of the site’s RSS feed, articles about me, or the analysis of device use. Others, such as those about health benefits of golf, carbon and nitrogen, and the topic index on the blog, might have slipped past many readers the first time around. Counting down from 10 to 1, here they are:
[10, tie] August, Piper and Pebble Beach, in which there is an intriguing link to Charles Vancouver Piper, the first director of the USGA Green Section, at Pebble Beach.
[10, tie] May, You have been featured, in which I was informed of my inclusion in the latest issue of Golf Digest India.
[9] October, Golf and health, I don’t know why these posts are not the most viewed every year. Don Mahaffey has been talking about this for years, in plain language, saying “Golf is good for you.” There is plenty of research to support this, and on a global level it would seem this aspect of golf is important.
[8] March, Par Golf Impact Manga, which describes a golf course superintendent who is featured in a weekly magazine in Japan.
[7] February, If you are reading this by email, describing some fixes to the site’s email feed to show the full content now, rather than a snippet.
[6] February, When does it usually rain in Bangkok?, I asked, in an analysis of when the rainy season usually starts there. Someone had asked me that question, so I looked at some recent (previous 10 years) data.
[5] March, Times and words from ten thousand tweets, in which I looked at a summary of what I’d tweeted about, and when I’d sent the tweets, after the first 10,000 had been sent from early 2011 until early 2018.
[4] December, One bucket at a time, announcing the new book about clipping volume. I’d already shared this across multiple platforms by the time I published the blog post, plus this was just after Christmas when I suppose many people weren’t reading much about turfgrass.
[3] April, Blog visits by device type, a topic that is predictably in the bottom 10 every year. But I keep it going because I find it interesting.
[2] June, “Relative to their own requirements, animals and microbes live in a carbon-rich, nitrogen -poor world”, with the 2nd lowest views in 2018, which surprised me because another post about carbon fertilizer was a top 10 post.
[1] June, Posts are now tagged by topic was another surprising one in terms of low view count. Even though I didn’t get the tags set up until the middle of the year, that topic page is now the second most viewed page on the entire site. So please check it out if you haven’t seen it yet; from that page you can easily find posts by topic.
That was the list for 2018. And here are some from previous years.