In this series of posts, I’ve showed how one can start with temperatures and go all the way to a standardized comparison of growth in response to nitrogen supply. In this one, I want to emphasize which of these are real, which aren’t real but are useful, and to make an argument that this is a lot easier than it might seem.
If you are catching up, here’s what came before:
- part 1 about temperature and standard N amounts given those temperatures
- part 2 about the actual N applied given those temperatures, which I call the genki level (GL)
- part 3 discusses the grass response to the temperatures and the GL, by measuring clippings
- part 4 makes a direct comparison of the nitrogen fertilizer and the clippings, both adjusted for temperature
What is real
The only real things in all of this are:
- the temperatures
- the nitrogen applications
- the grass clippings
Not real, but useful
The things that aren’t real, but are calculated values that I find useful are:
- the temperature based growth potential (GP)
- the standard N based on GP
- the actual N compared to standard N, or genki level (GL)
- the standard GP-based clipping amount
- the actual clippings compared to standard clippings—the speedo
- the ratio of GL to speedo
How are these useful?
First, for any location, these calculations provide an easy way to optimize conditions. This happens by considering and then adjusting the growth rate of the grass to produce the desired conditions. Looking backward, evaluating the present, and planning ahead, these calculated values are easy to use as a way to make improvements. Or, if the grass is already perfect, to keep it that way when temperatures are different.
Second, for any location, these calculations provide an easy way to integrate (or get started with) new maintenance strategies that have been learned from other turf managers.
I’ve written more about this in the Short Grammar of Greenkeeping.
The simplicity of this
It might seem complicated, but one has this information already. All the charts and calculated values happen instantly in the background; all this can be done automatically by a computer.
Every turf manager has the temperatures and forecast temperatures. Every professional turf manager knows the N that has been applied. That’s all one needs to use the GL. The calculations are all made by the computer.
To look at the growth and use the speedo, one needs some measurement of growth. And that’s pretty easy to get. I’ve written about that in One Bucket at a Time.
Emptying clippings into a bucket for #ClipVol measurement only takes a few seconds. And one needs to empty the basket anyway.
An example from start to finish
I have temperature and N application and clipping volume from Hazeltine National GC, so I’ll show how this progresses. One can infer how the information might be useful.
Many turf managers will have data from an onsite weather station or will get temperatures from another local source. I’ve used Dark Sky to get temperature data for the latitude and longitude coordinates of Hazeltine National Golf Club in 2018.
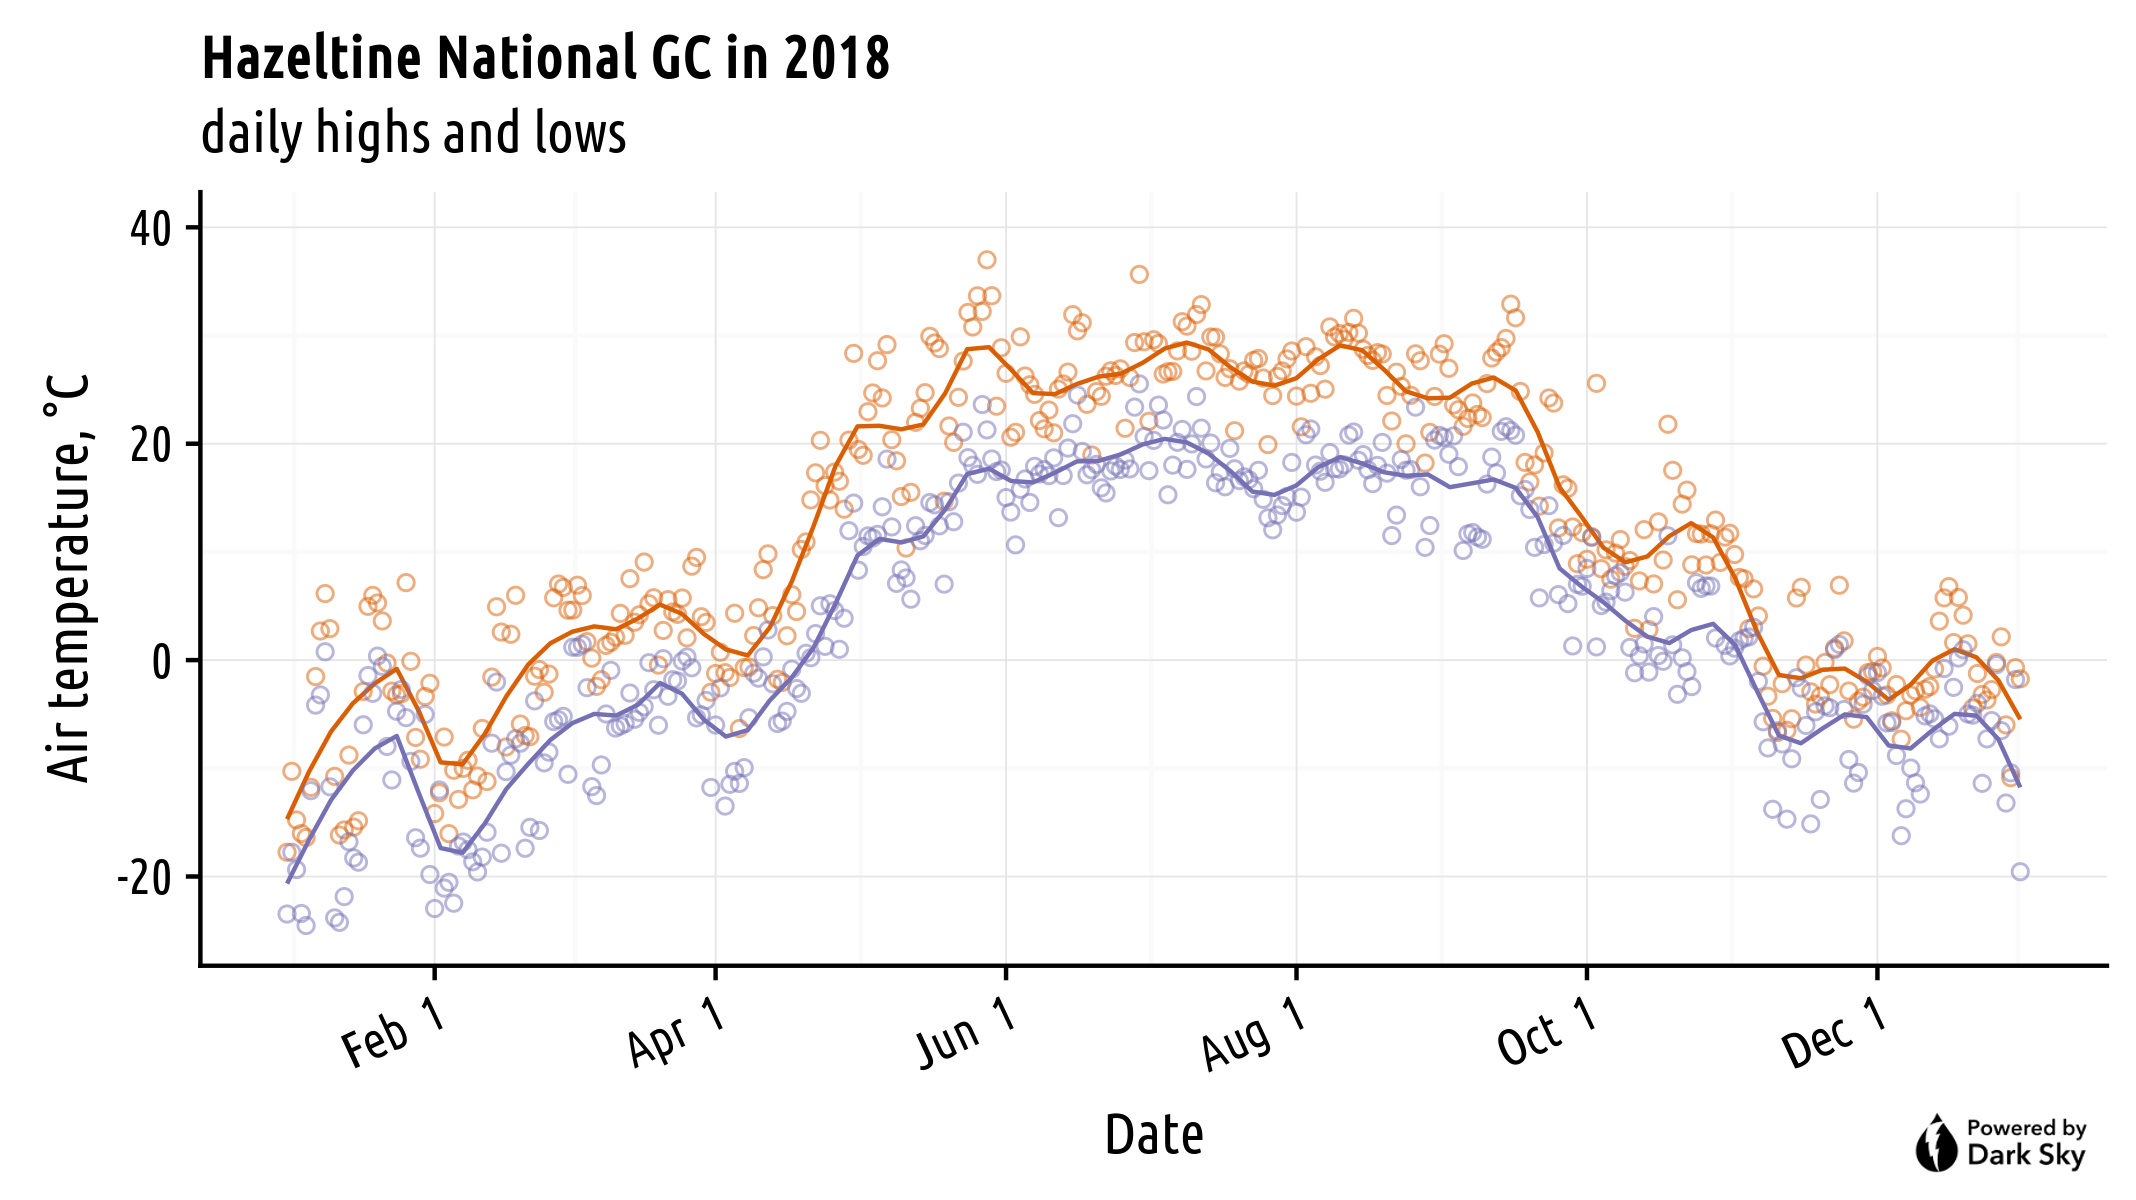
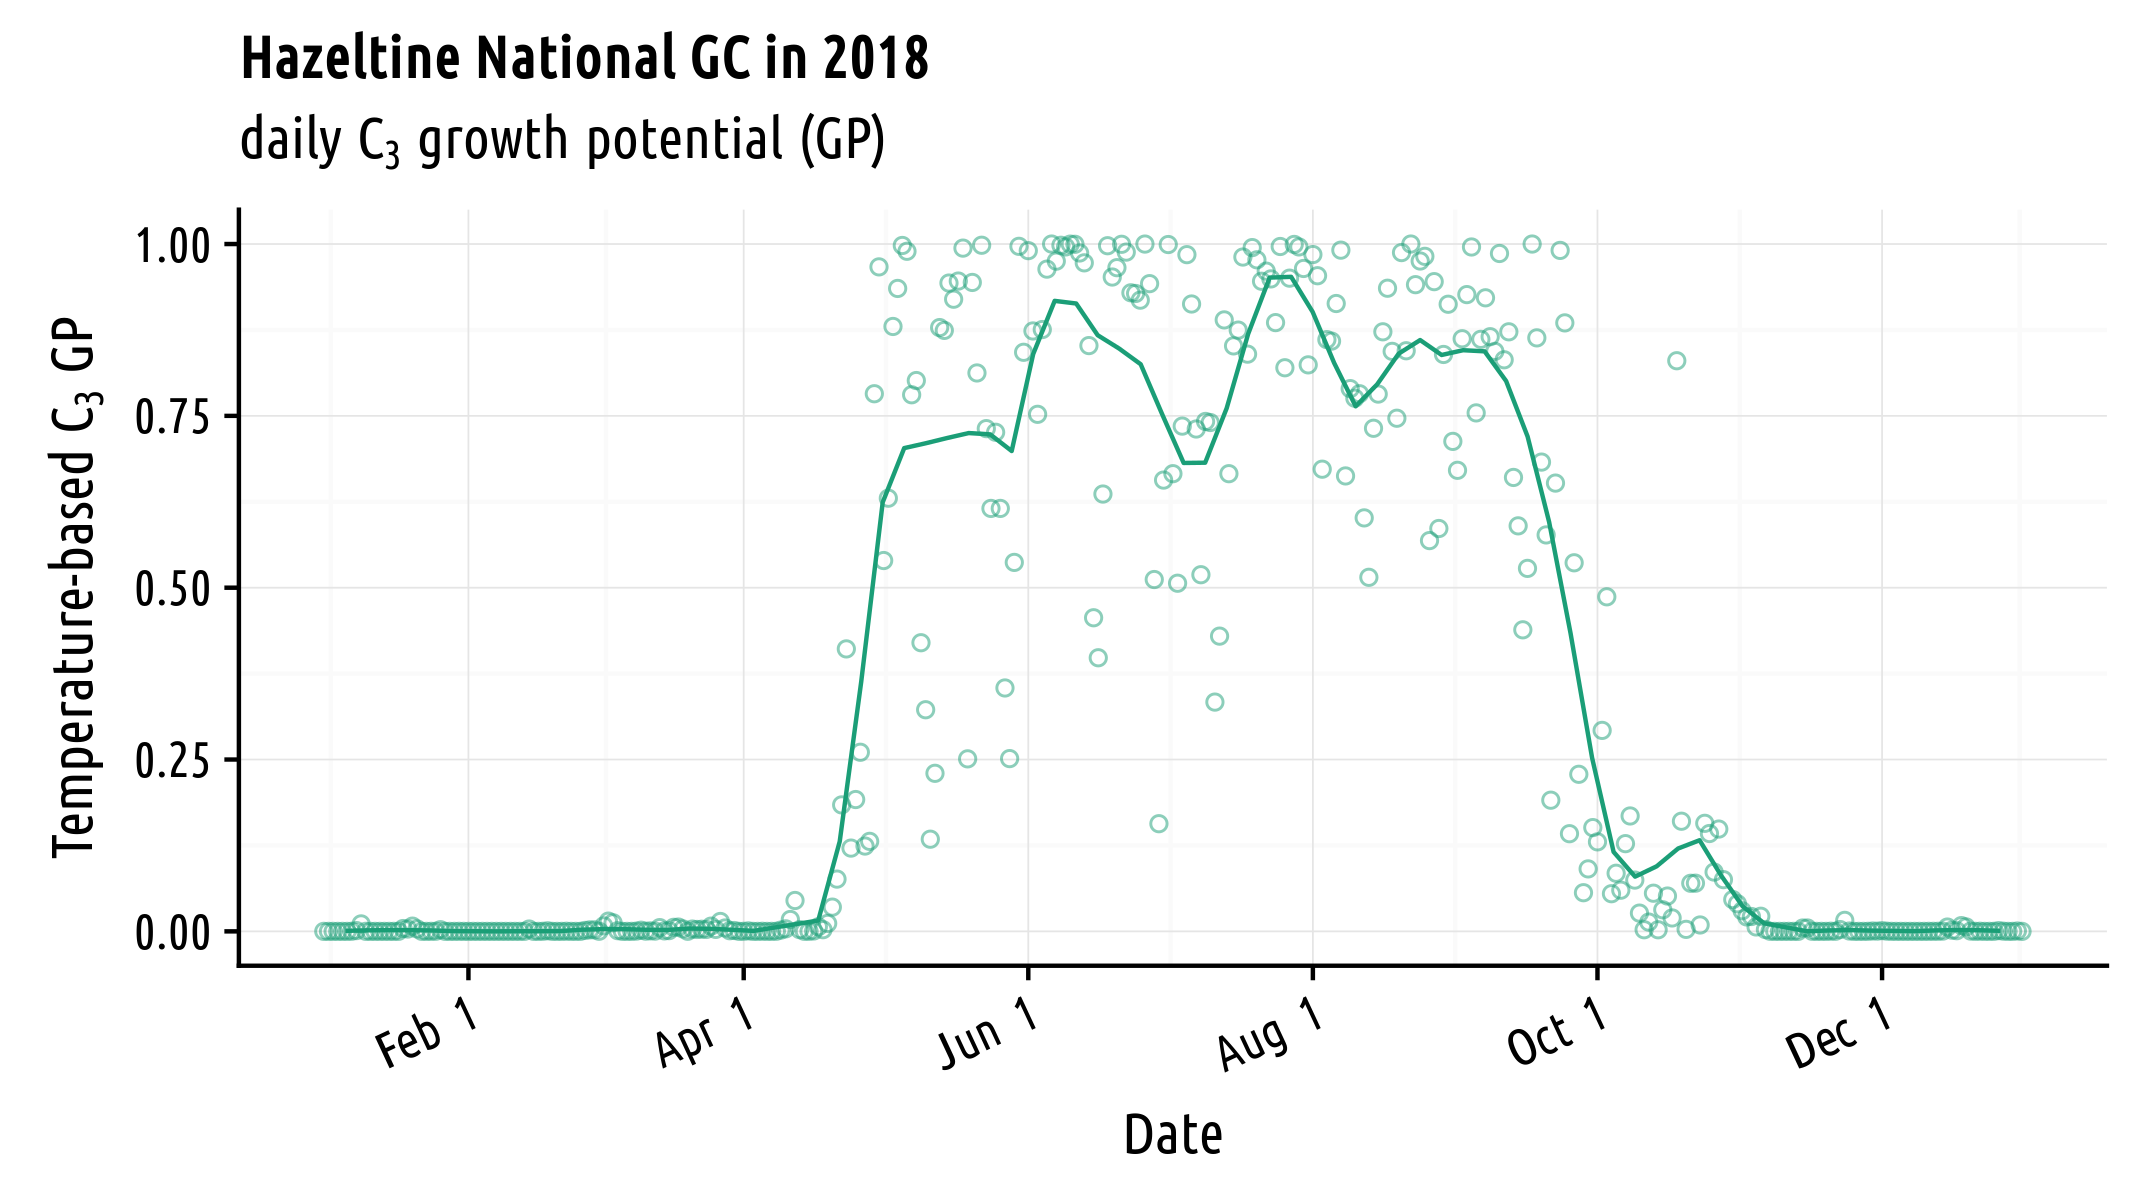
Those temperatures are something real. I then transform them to something that isn’t real, but is useful. That is the temperature-based growth potential (GP) of PACE Turf. The GP is useful in a lot of ways; here it is shown as a visual representation of the growing season for cool-season turf at that location in 2018.
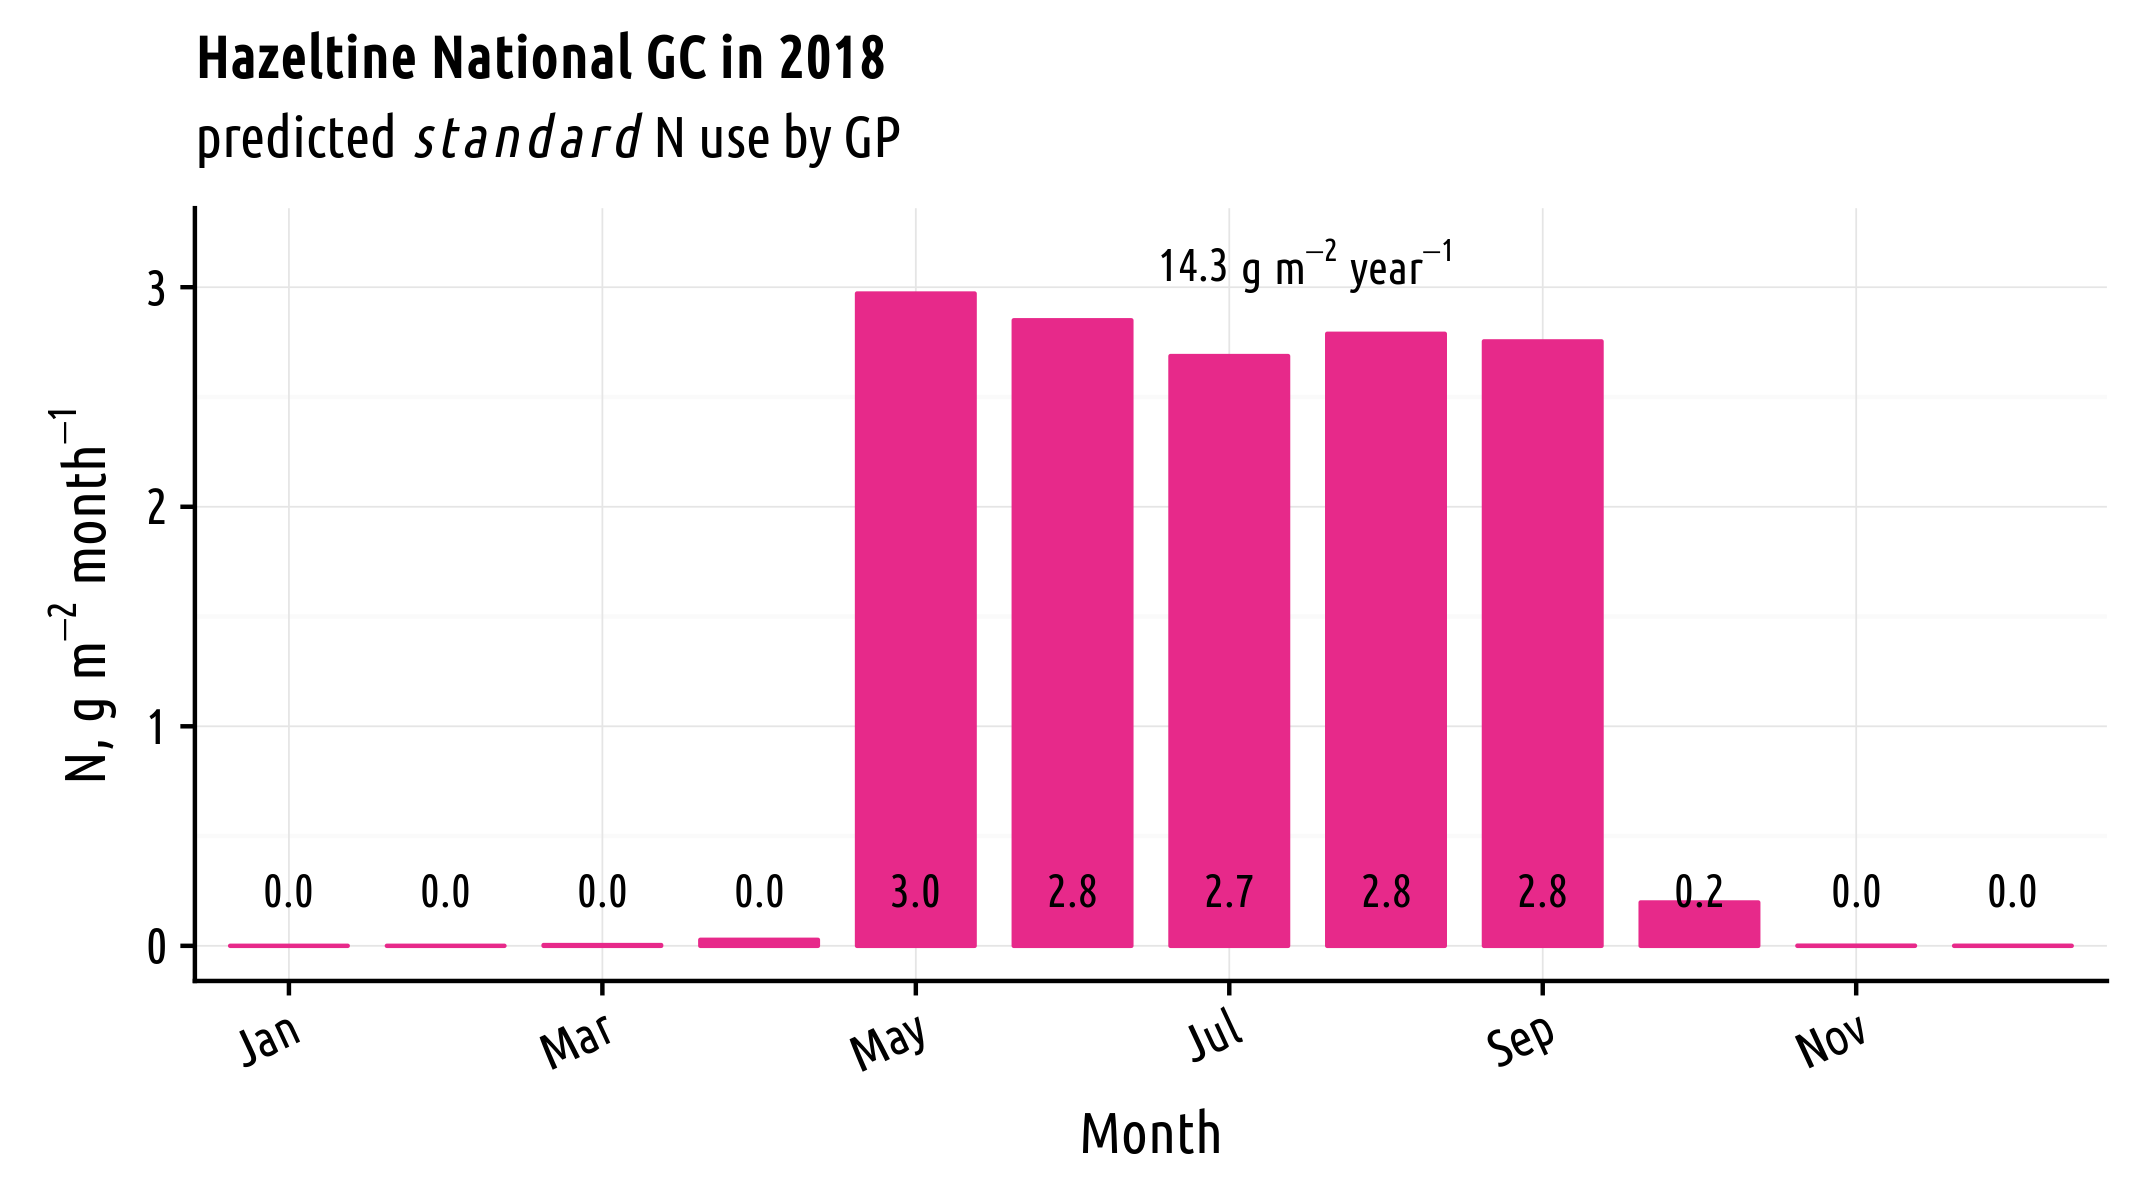
I then make a further calculation to show, on a monthly basis, what I call the standard N. That is based on GP and a maximum monthly N for bentgrass of 3 g N m-2.
The nitrogen applied each month is something real; I’m representing it in the next chart as the genki level—that is the actual N supplied divided by the standard N.
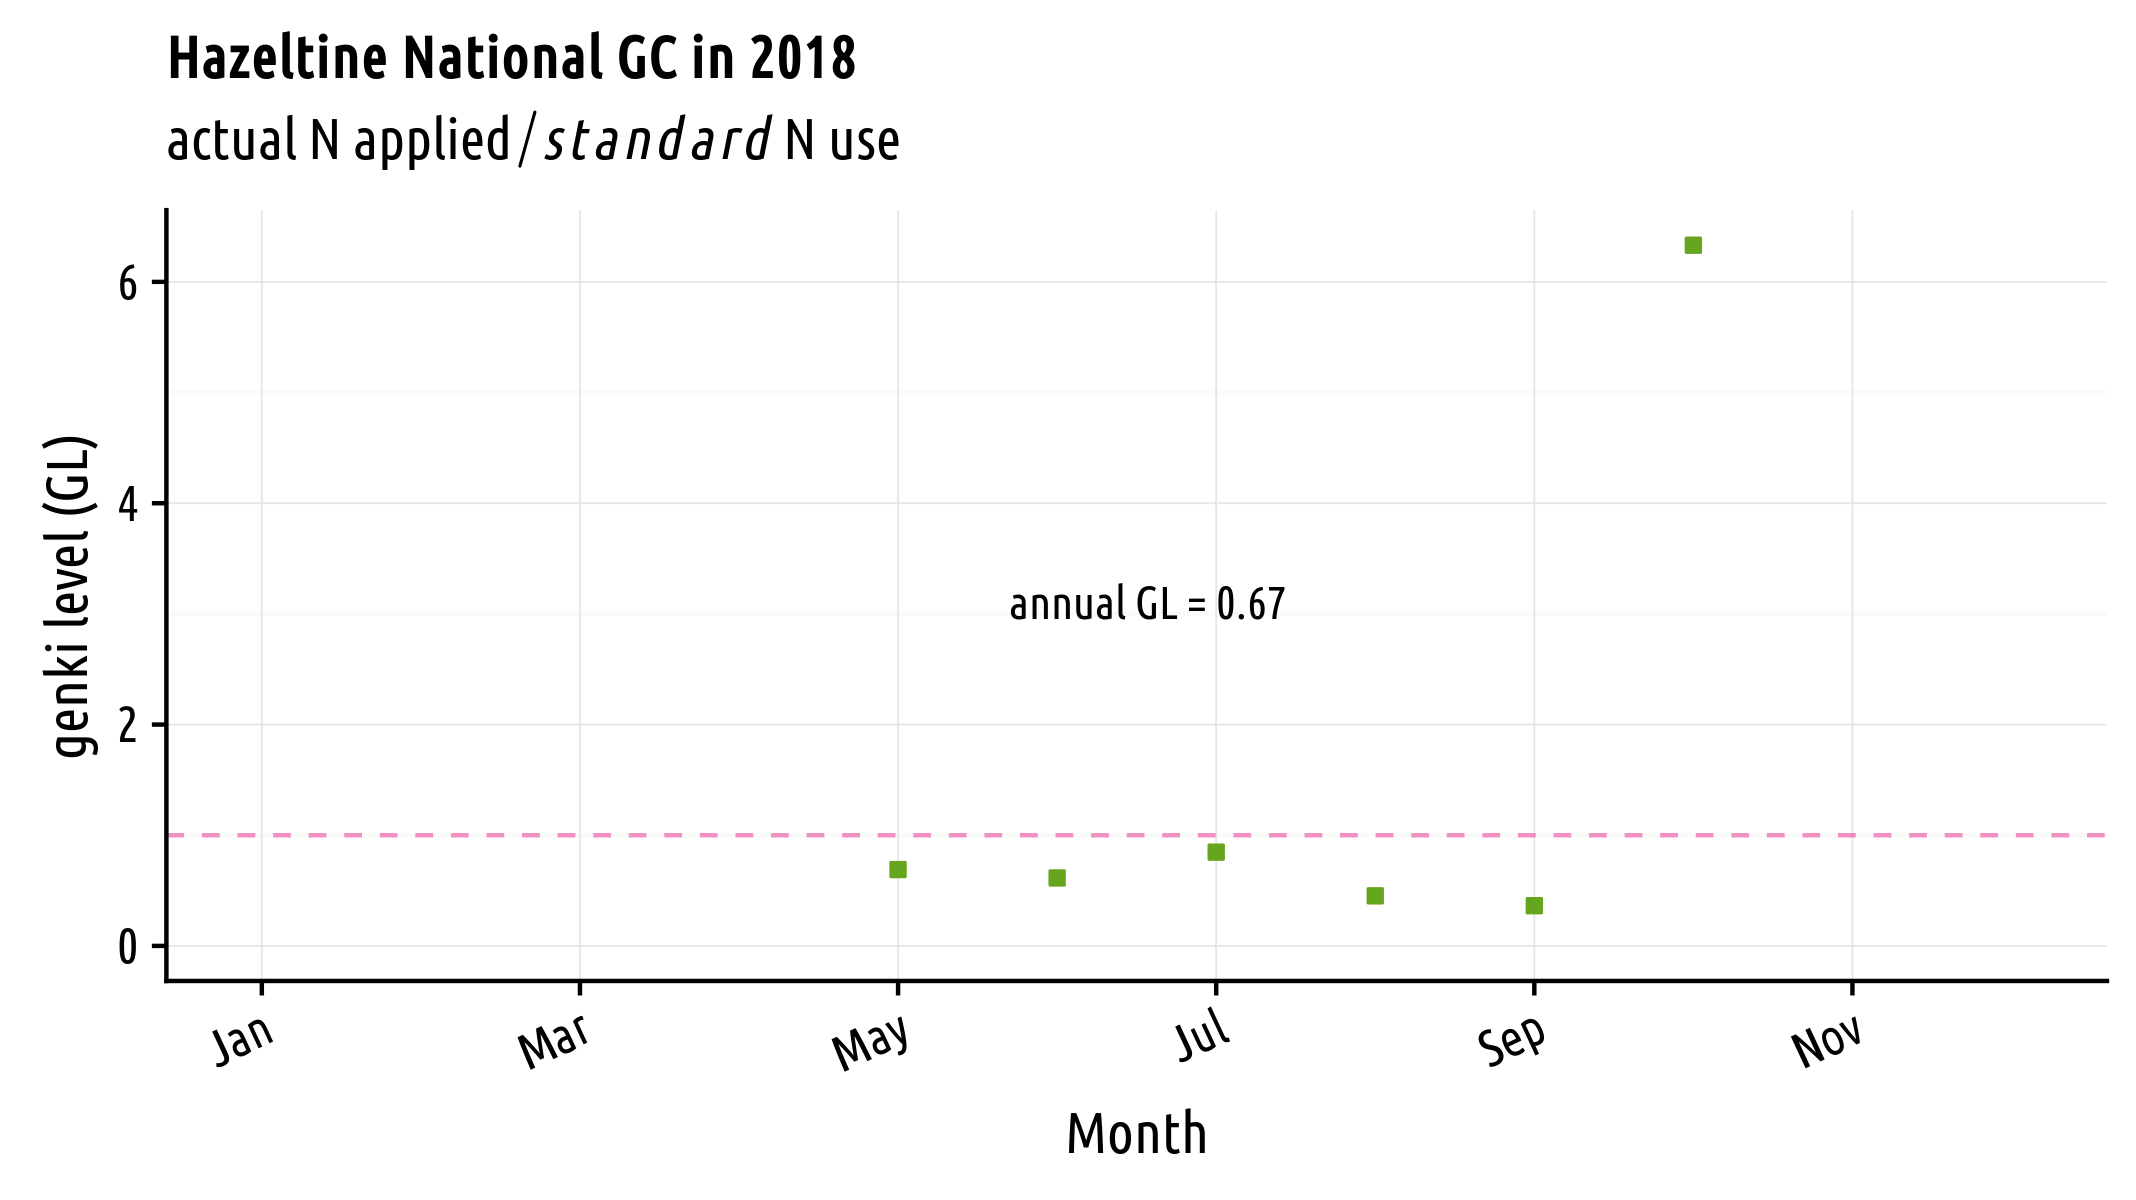
The genki level corrects for the expected or potential growth that can occur at any location because of temperature. When the grass grows more, it uses more nutrients. When the grass grows less, it uses less nutrients. By using the genki level to look at N applied, one gets an idea of how much the grass was being pushed or starved of fertilizer N at any particular time.
A note here: I made the calculations here monthly. One can set it up to look at these daily, weekly, or on any time interval of convenience.
The grass growth response can be monitored by the clipping volume. Now we are looking at something real again. Temperature is real. The actual N applied is real. And clipping volume is real.
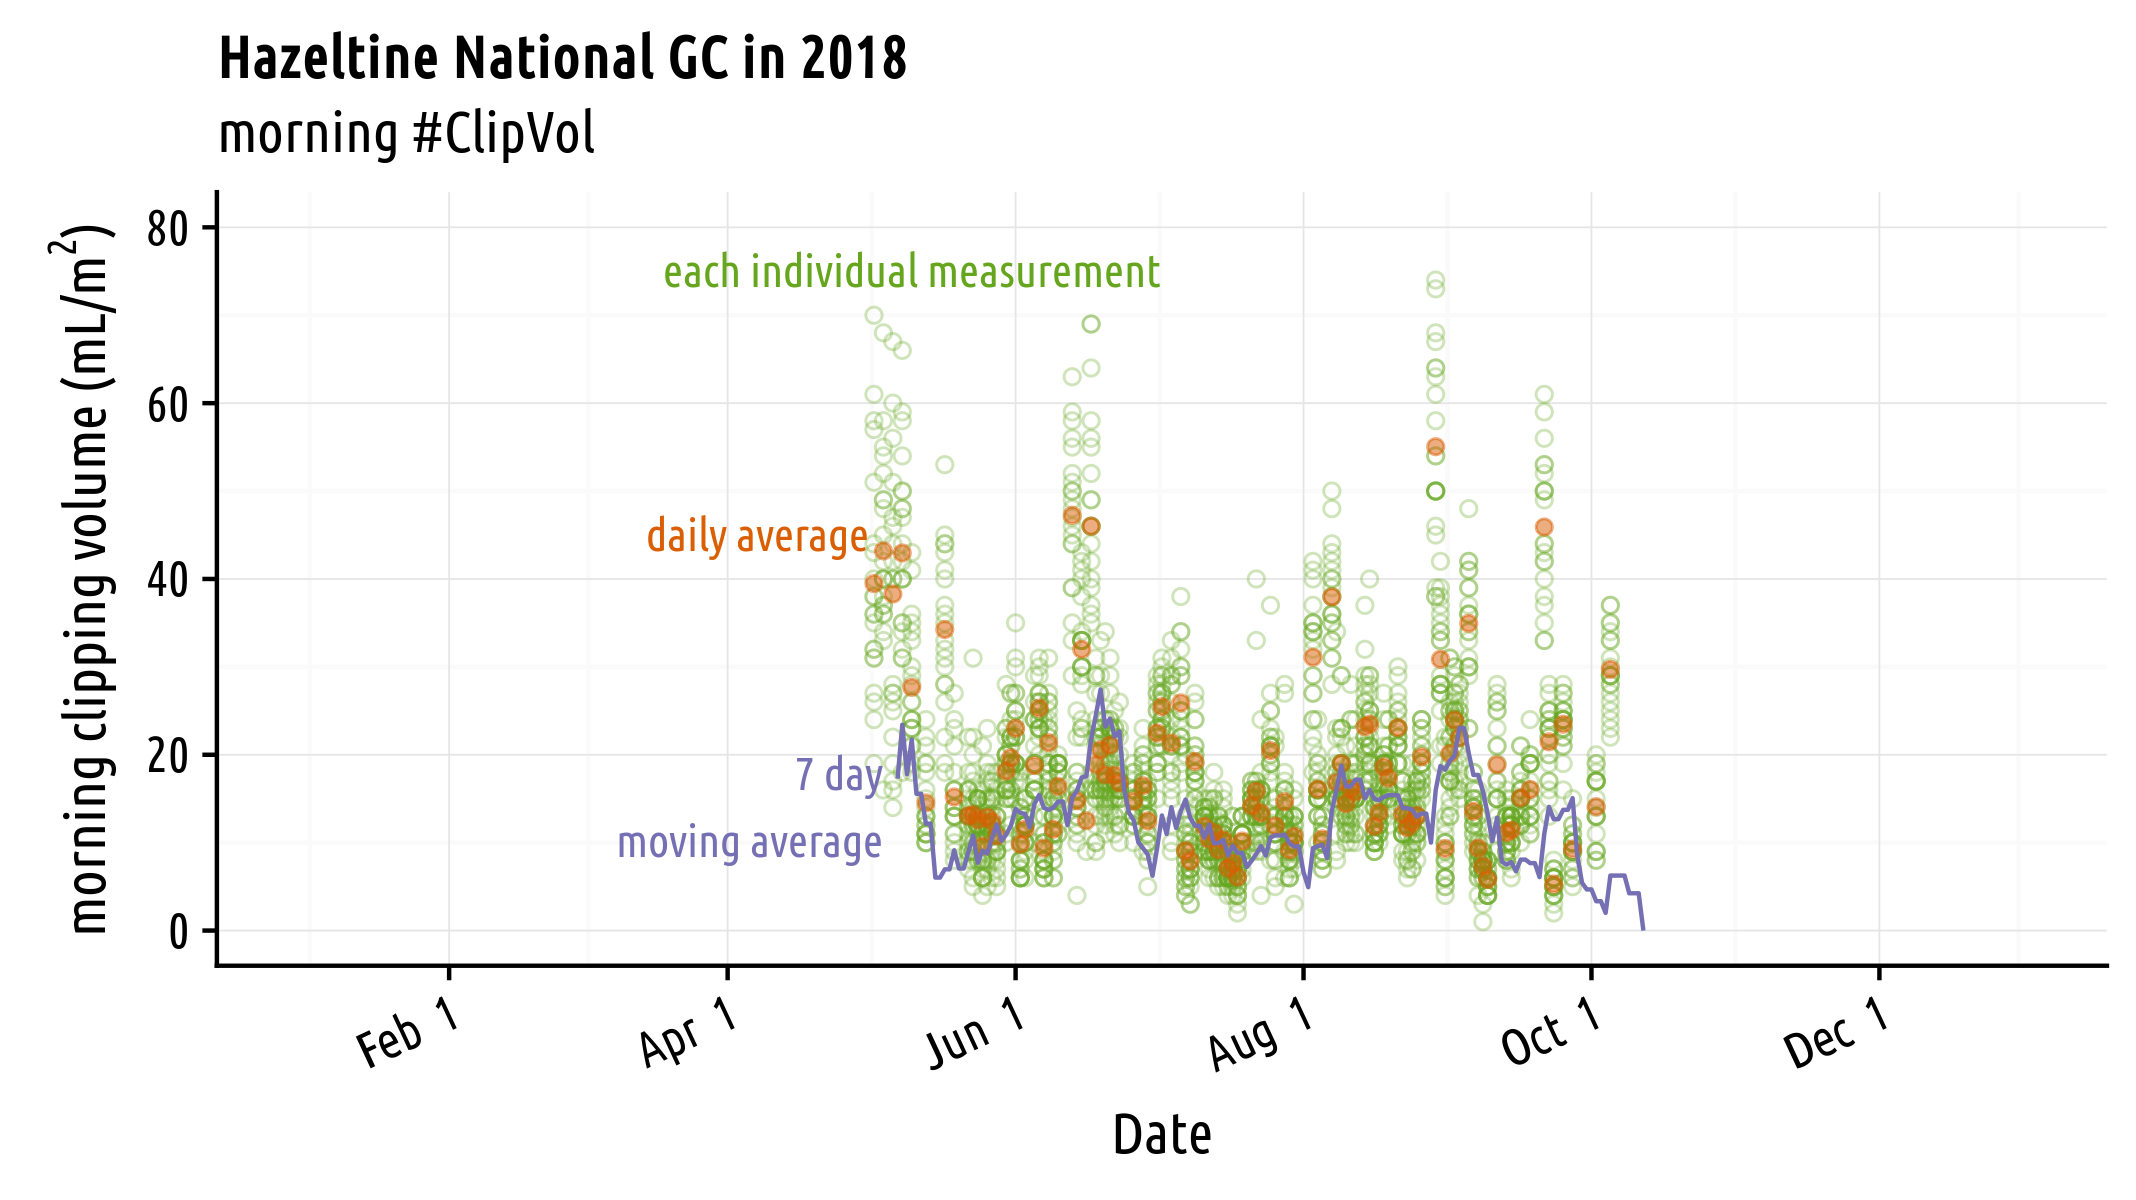
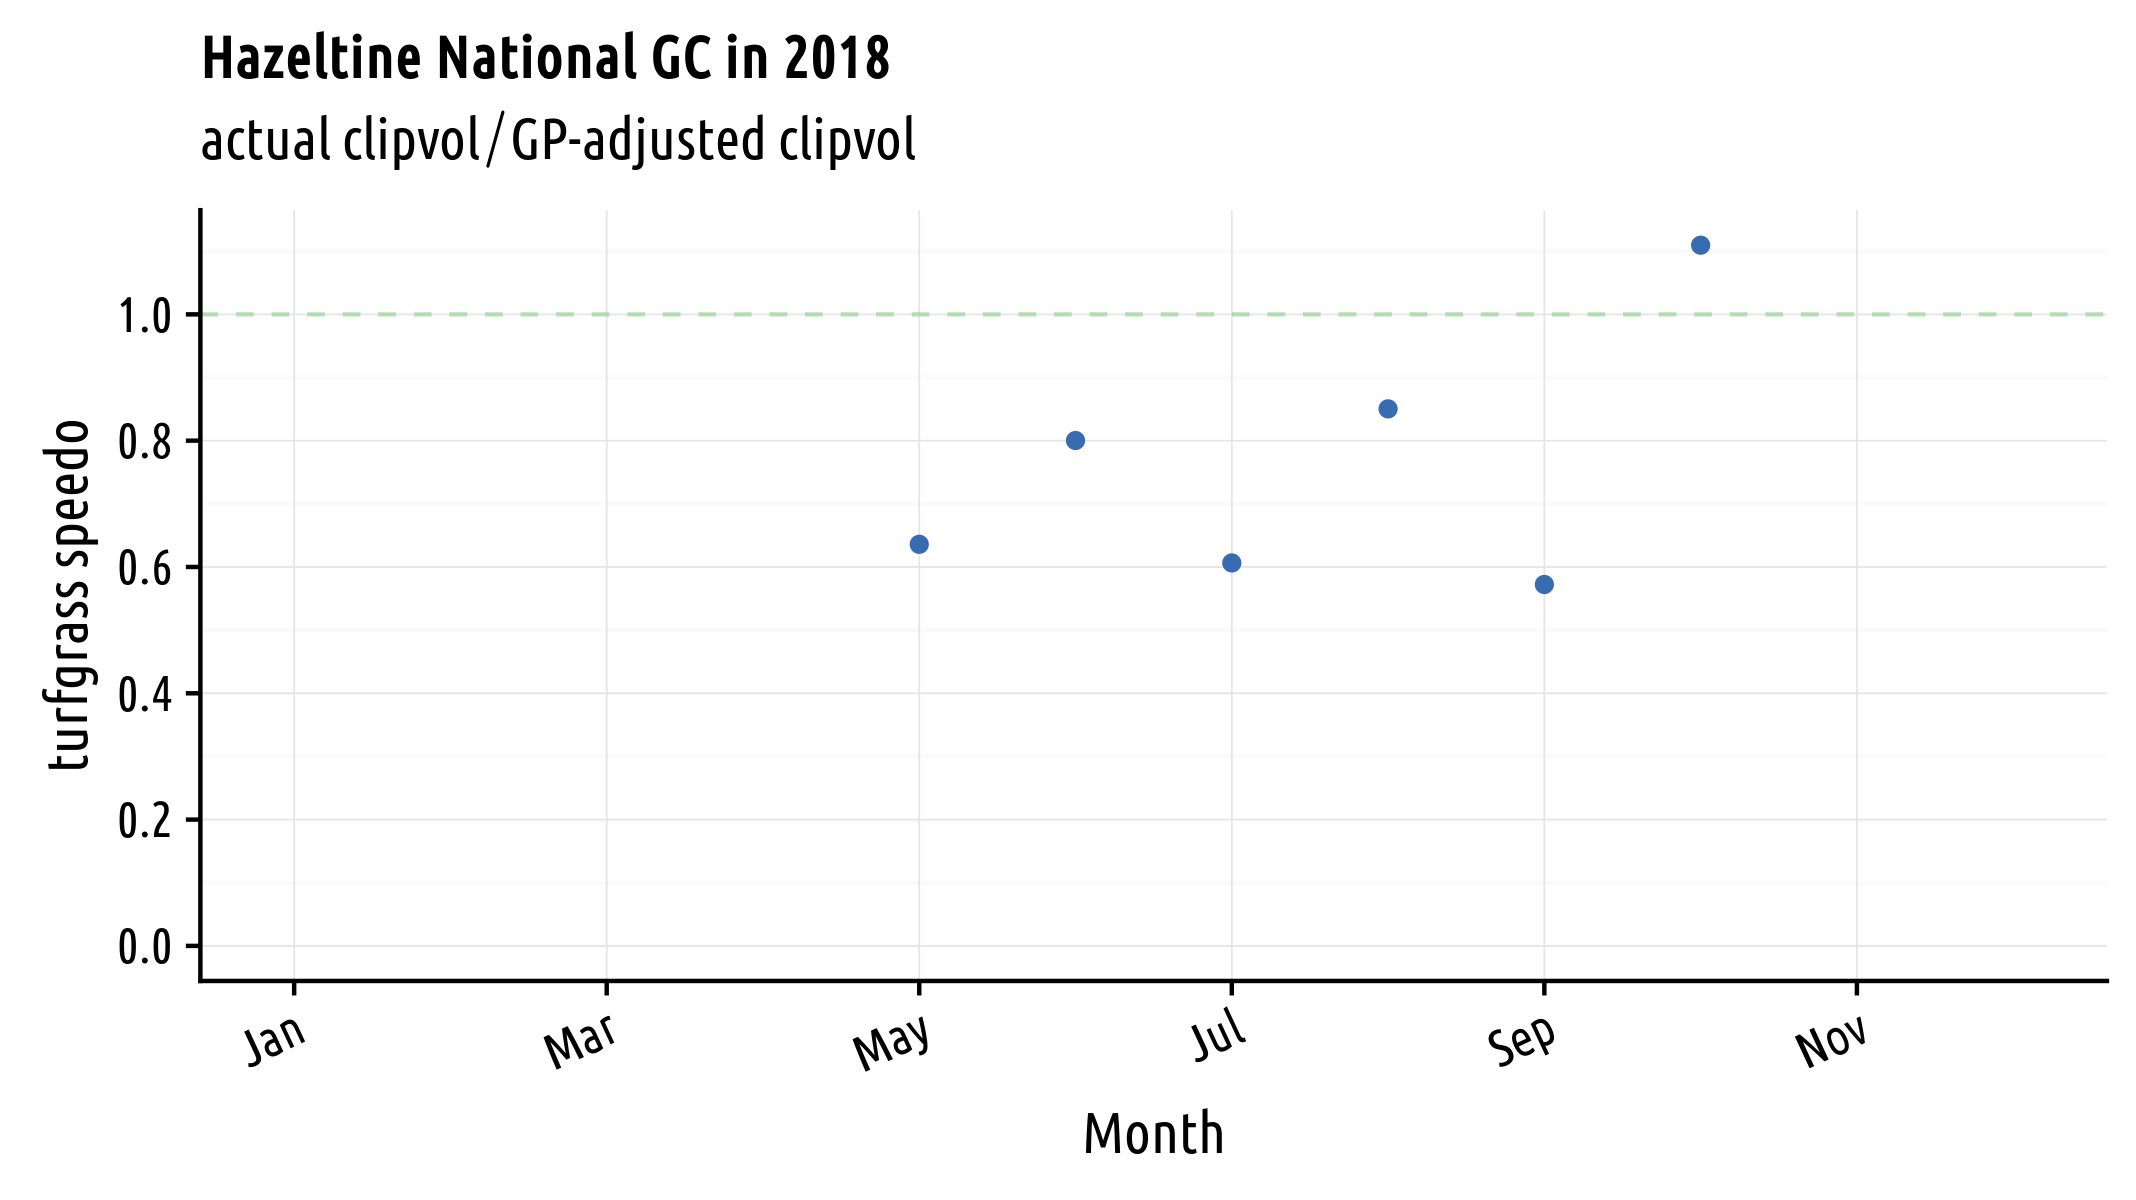
I’m going to make another correction to the clipping volume data, however, by converting it to a turfgrass speedo. For this chart, I’m using a maximum volume of 600 ml m-2 month-1, and then calculating the speedo as the actual clipping volume divided by the product of the GP and 600 mL.
What good does that do? Just like the genki level adjusts the N fertilizer to the potential for the grass to grow, so the speedo adjusts the actual growth to the temperature-adjusted expected growth.
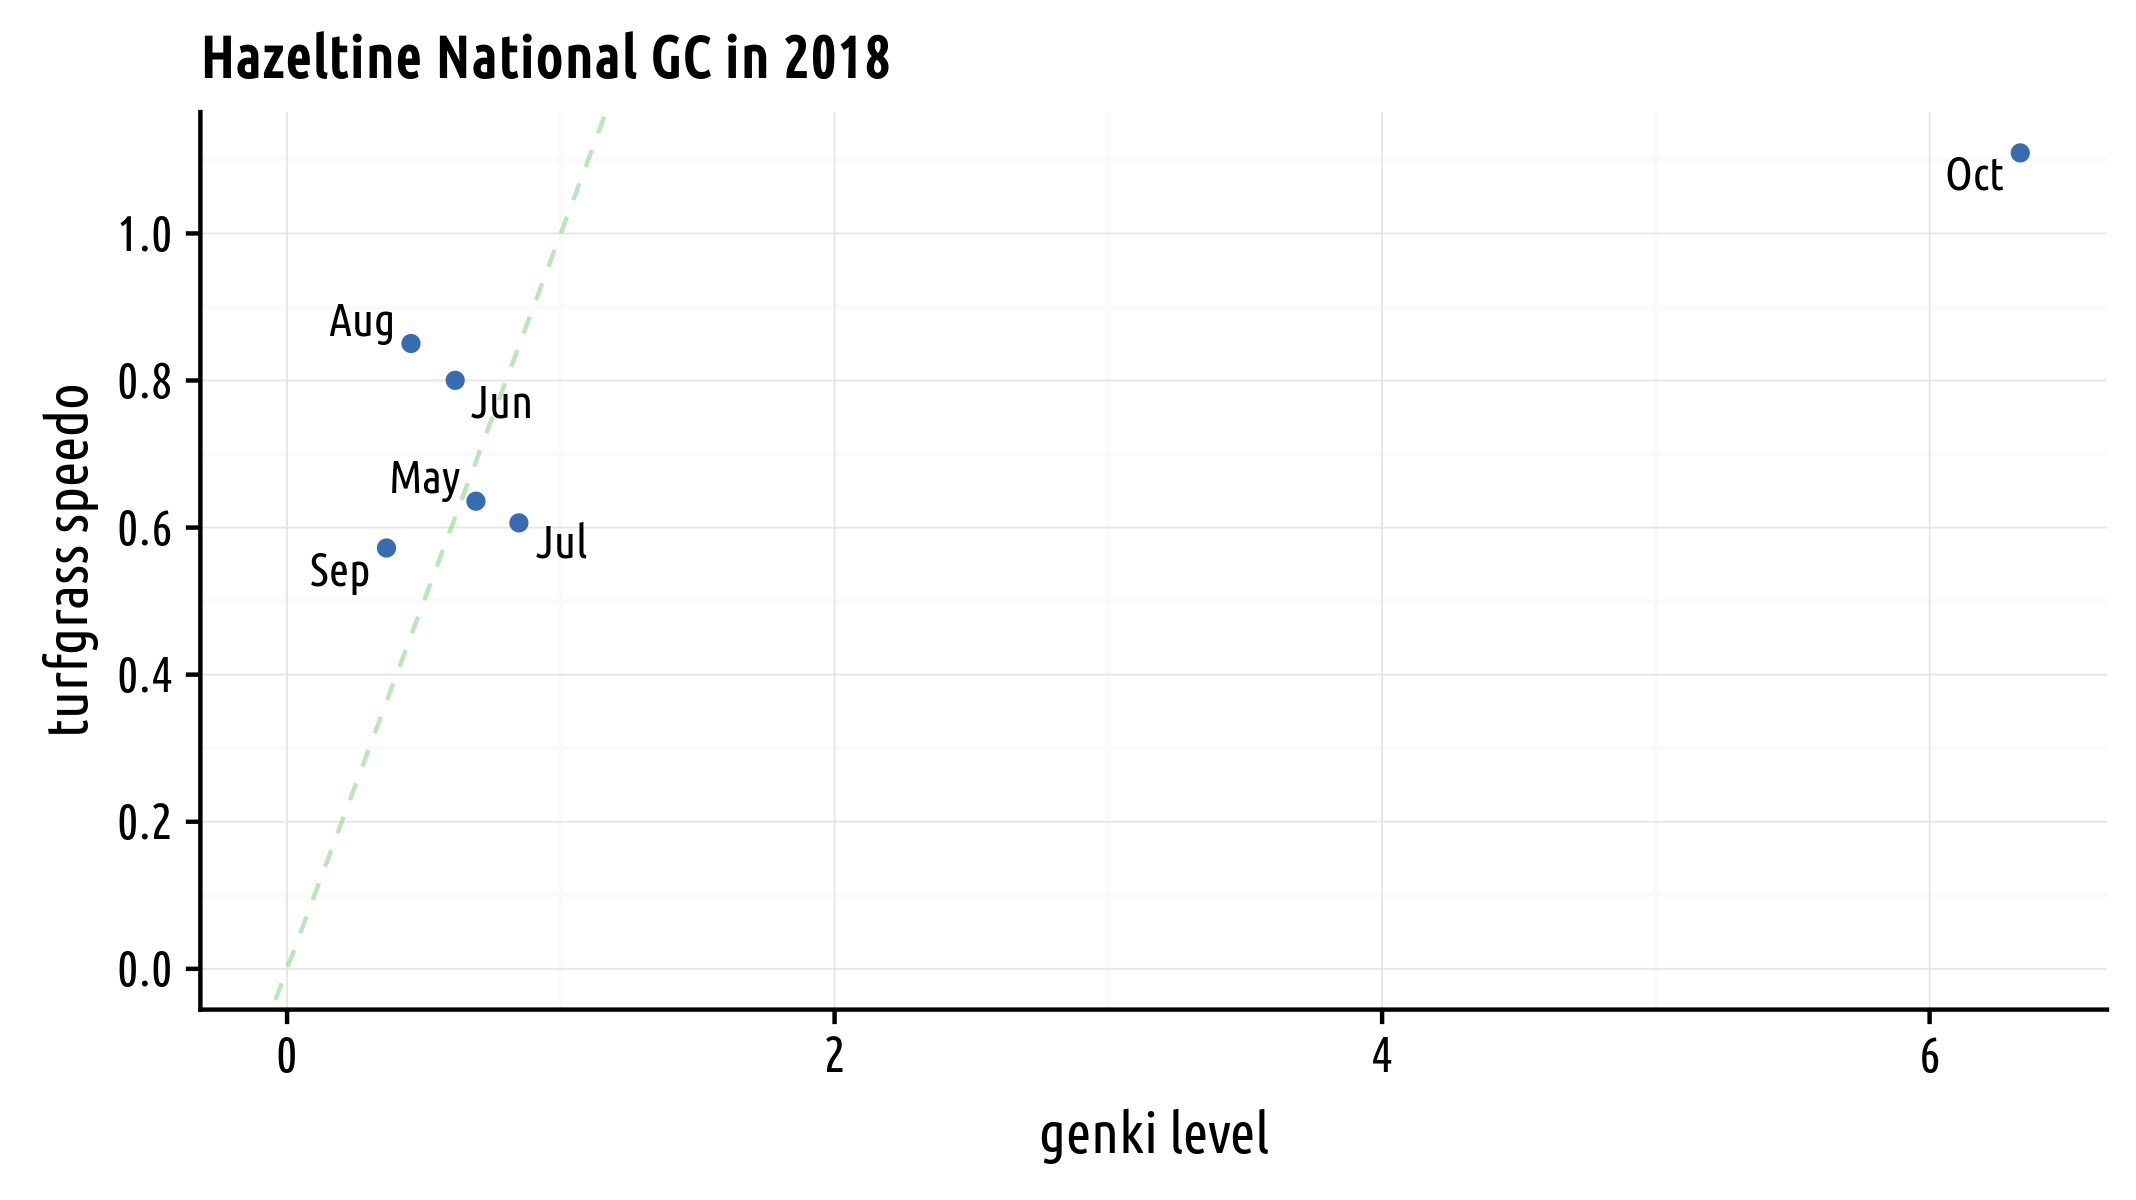
Finally, I compare the genki level to the speedo. These are two real things—the N applied and the clippings collected—adjusted by another real thing, the temperature at that location.
Turfgrass perfect and want to do exactly the same as last year? Then do the same, adjusting for this year’s forecast temperatures. See some areas that can be improved? Consider how adjusting the growth and the timing of the growth might move the turf closer to the desired conditions. Talked with a friend from a neighboring state or from another part of the world, and learned how their management is producing great results at a certain growth rate or timing or fertilizer rate? Easily apply the same processes at your facility, adjusted for the growing conditions at your site.
And if you have read all the way to the end of this, don’t like numbers, and are happy managing by feel, then thank you for reading. That’s a fine way to manage turf too.