There’s a ton of work done to modify the soil organic matter of turfgrass surfaces. Fertilizer, water, and increased light will allow the grass to grow and naturally increase the organic matter in the soil. Sand topdressing will increase the mass of the soil without adding organic matter, so that causes a decrease in soil organic matter by weight. And verticutting and scarifying and more intensive cultivation remove some organic matter and make space for sand.
Bert Sandell shared an interesting chart, looking at how organic matter varies across a single putting green. This is important for a lot of reasons, and as Bert noted, it is a common question.
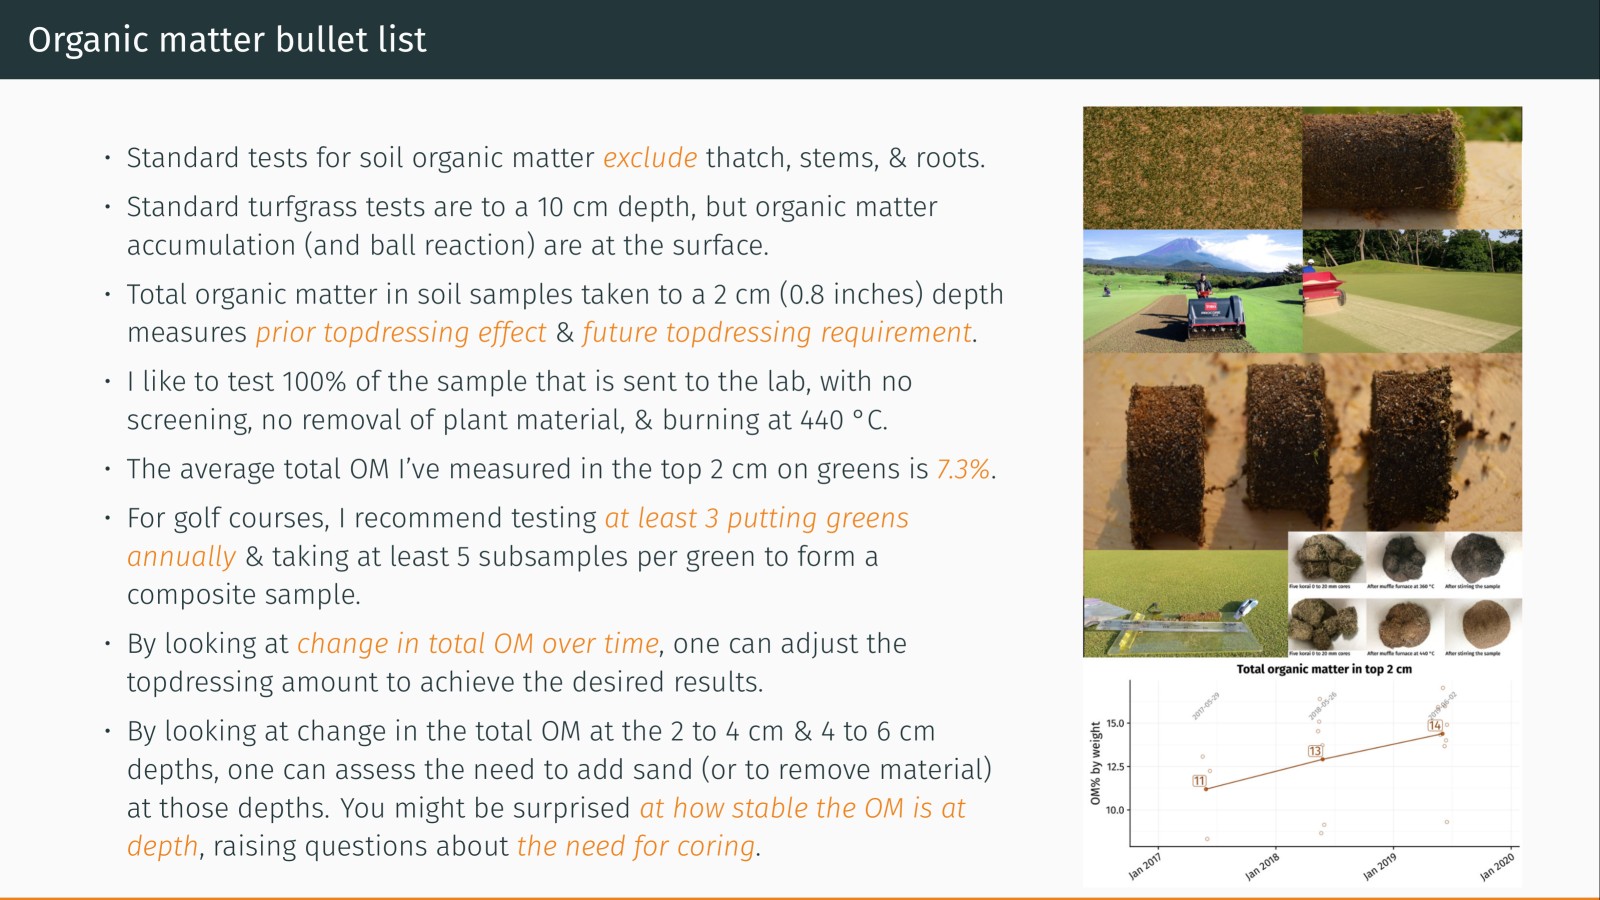
First, to put this in context, I recommend having a review of this organic matter bullet list.

Next, why is this important?
One reason is for sampling accuracy. If one is going to make decisions about sand topdressing and other cultivation practices for entire green surfaces or for a set of say 20 greens, it’s crucial to get samples that are representative of the area to be treated. Knowing how much the total organic matter varies allows one to calculate the number of subsamples required.
Another reason is to understand what is happening on different areas of the same green, or from green to green on the course. I’ve noticed that the healthiest greens on a golf course usually have a little more total organic matter in the top 2 cm than do other greens on the same property. Those greens with more surface OM also tend to have a bit more soil moisture, and also to be a little softer. When one looks within the same green, it is expected that areas with bunker sand splash might have lower OM, shaded and high trafficked areas might have less OM, and areas with the best growing environment might have higher OM.
There will be some variation from subsample to subsample, but how much is normal?
What is the spatial variation of organic matter in a golf green? #CommonQuestion This is Loss on ignition of nine samples from one green. #turf pic.twitter.com/p4p221Fq8u
— Bert Sandell (@BertSandell) July 4, 2020
Bert shared that in this set of samples, at the 0 to 25 mm depth (1 inch—I prefer cutting to 20 mm for even more precision, but 20 and 25 mm are practically the same), the mean was 58 g/kg (5.8%) and the standard deviation was 6.5 g/kg (0.65%).
That’s a coefficient of variation (cv) of \(\frac{6.5}{58} = 0.11\) or 11%. What that means is on average, going from one point on the green to another, the organic matter will vary 11% from the average organic matter across the entire green.
I was especially interested in this because I’ve been making similar measurements of total organic matter at multiple locations on the same green too. My data are from 16 greens, in 5 countries, planted to various species that include:
- hybrid bermudagrass
- creeping bentgrass
- Poa annua
- korai (manilagrass, or Zoysia matrella)
- seashore paspalum
- fine fescue
In total they make up 112 individual tests of total organic matter at the 0 to 20 mm depth.
For this set of samples, the median cv is 14%, with a minimum of 7% and a maximum of 32%. That is, the green with the most consistency had an average variation of 7% from the green’s mean as one goes from place to place. The most variable green had an average of 32% change in OM from the green’s average.
And for a typical green, I’d expect about 14% difference from the overall average of the green as one goes from point to point across the green.
I find that there is a lot less variation as one goes to deeper depths.
You can get this kind of sampling done through ATC, or with any of the Amplify consultants. In the UK this testing is available from STRI and ETL. NZSTI also provide these services, and I expect there are some other labs I’m not aware of that can run tests in this way.
For more about this, see:
-
a short blog post, Soil organic matter: a bullet list
-
an answer to: What protocol would you recommend for sampling greens for organic matter?
-
a long blog post, Total organic matter testing on putting greens: sample number and sample volume