I’ve been using the NASA POWER agroclimatology data for a few projects. I get the data using the convenient nasapower R package by Adam Sparks. There is also a web-based map data access viewer.
I’ve found these data really useful for a few particular things.
-
To get solar radiation data for a) estimating photosynthetically active radiation (PAR) and b) making evapotranspiration calculations.
-
To quickly get daily or normal data from any location where I don’t have easy access to ground-measured weather station records.
-
To get data for multiple places that I wish to compare, knowing that for purposes of comparison the data are all from the same source.
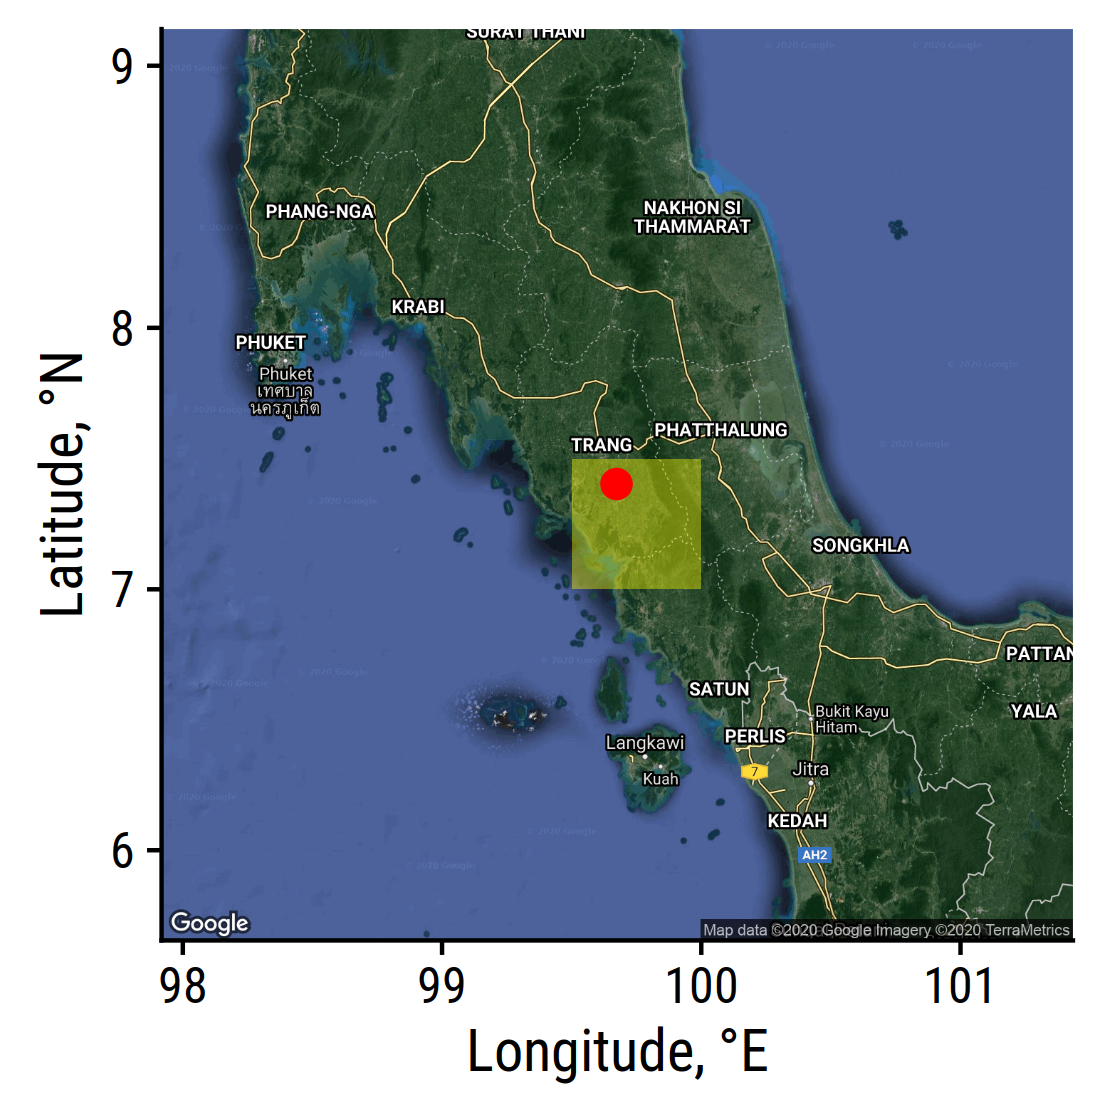
One thing that I’ve wondered about is the spatial resolution. The documentation says that “The data/parameters in POWER Release-8 are provided on a global grid with a spatial resolution of 0.5° latitude by 0.5° longitude.” I wanted to visualize that, by placing a rectangle over a map to show where the half-degree latitude and longitude borders are.
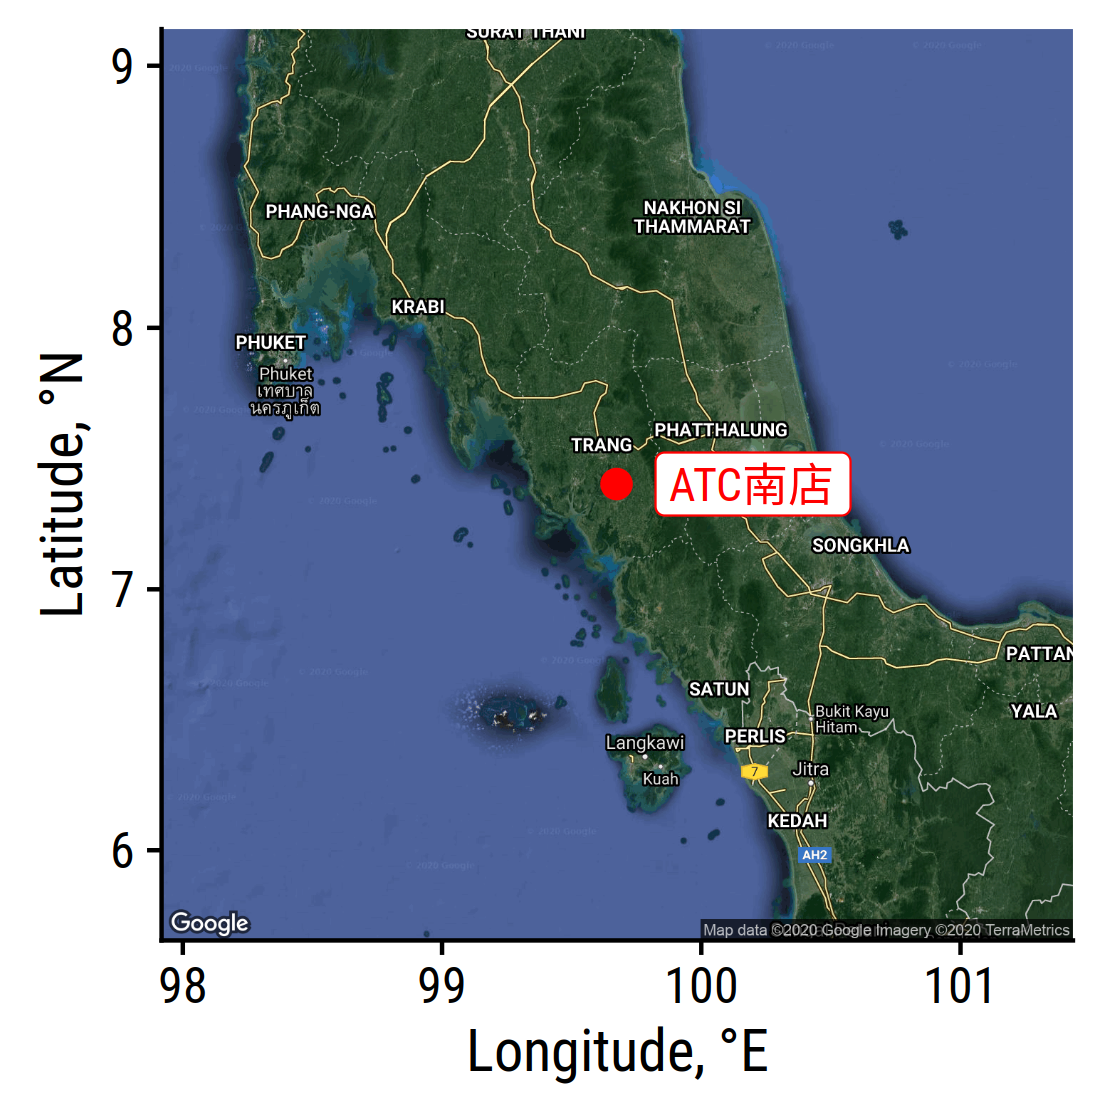
This map of southern Thailand and northern peninsular Malaysia has a red dot at ATC南店.
A yellow rectangle with the half degree boundaries of latitude and longitude show the spatial resolution of the POWER data. For ATC南店, I get data from 99.5 to 100° East and from 7 to 7.5° North.
As an example, these are the daily high and low temperatures (2 meters above the surface) for the past year + 3 weeks. These temperatures are pretty good for warm-season grasses.
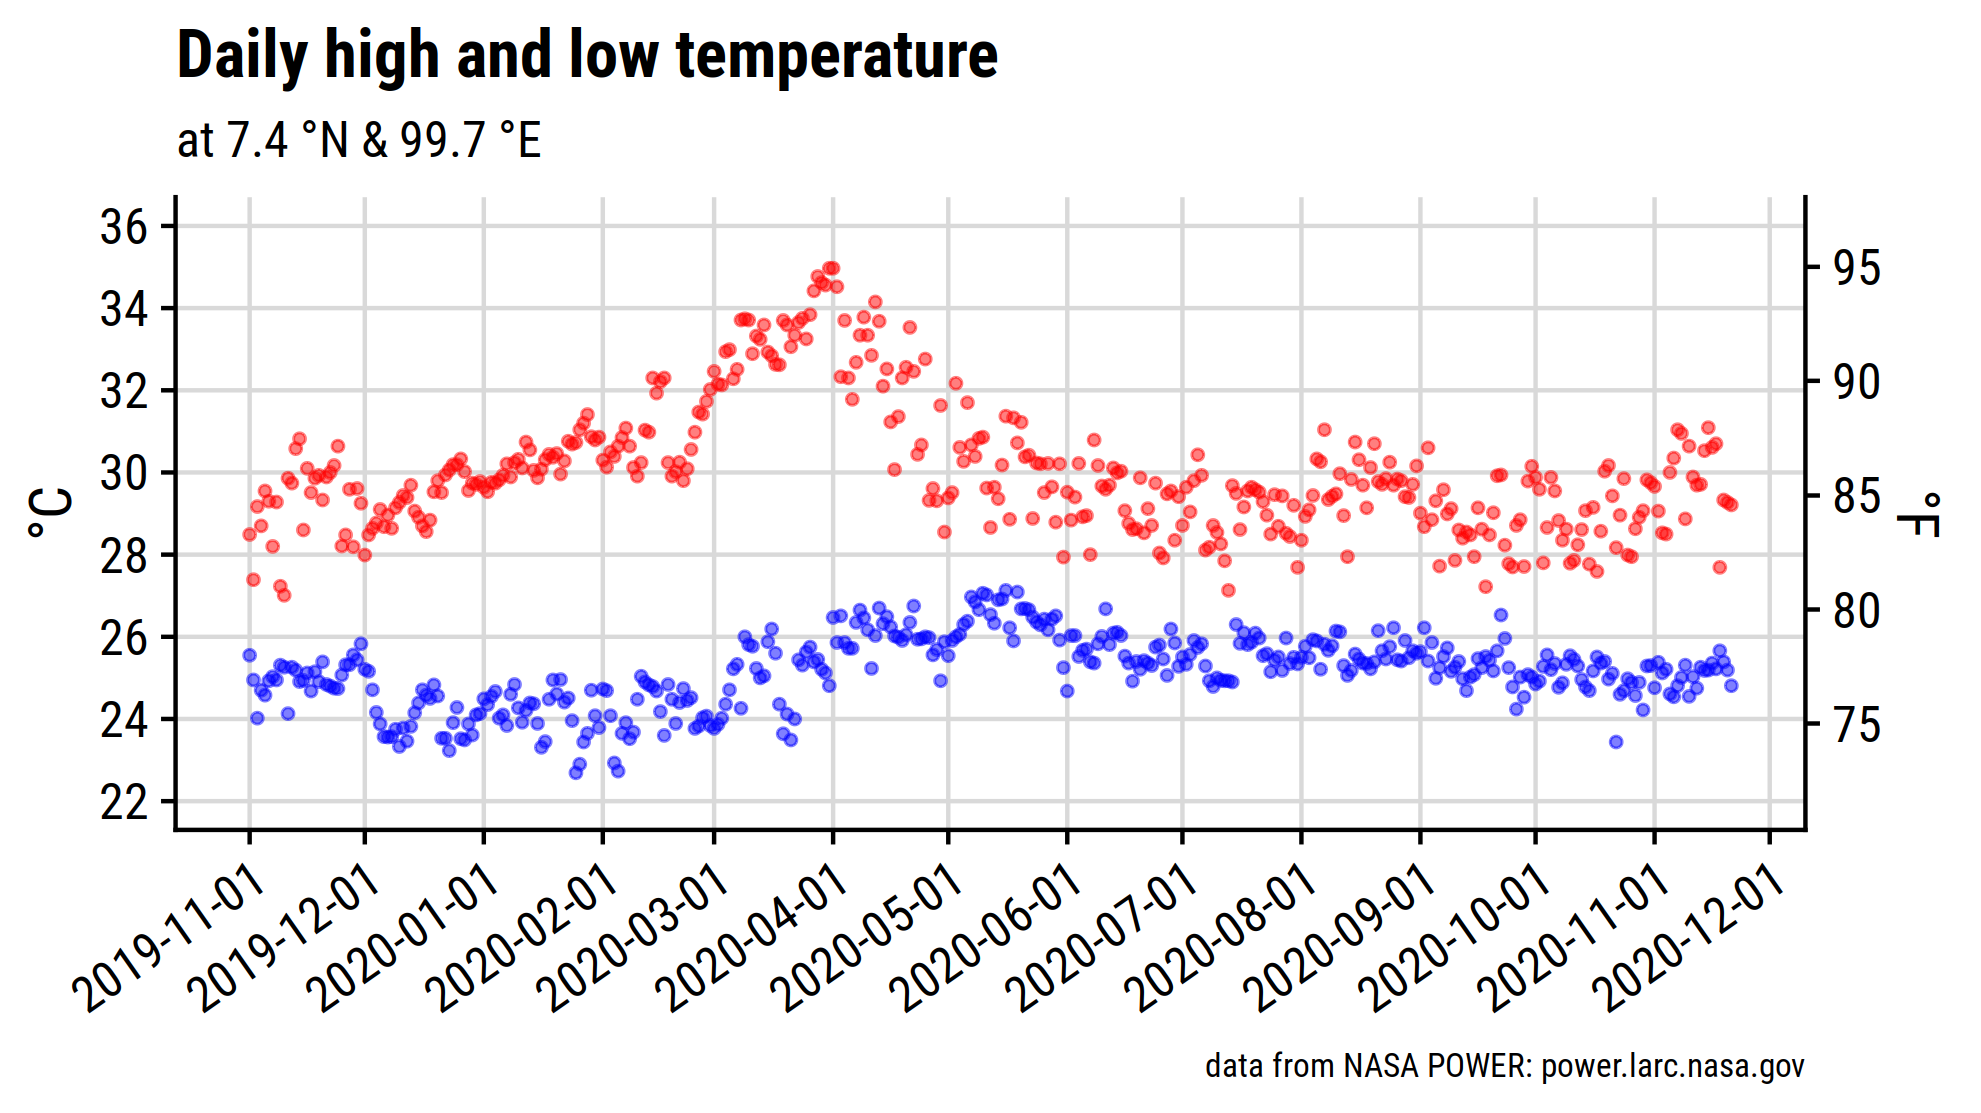
I can get temperature data from other sources too—for example from the records taken at the Trang airport. But in most parts of the world, it is difficult to obtain the solar radiation data at the earth’s surface (Rs); with the nasapower package I can get a year (or more) of daily Rs data with a single line of code (I’ll do an #rturf post sometime on my personal site with all the details) and a couple seconds to query the POWER API.
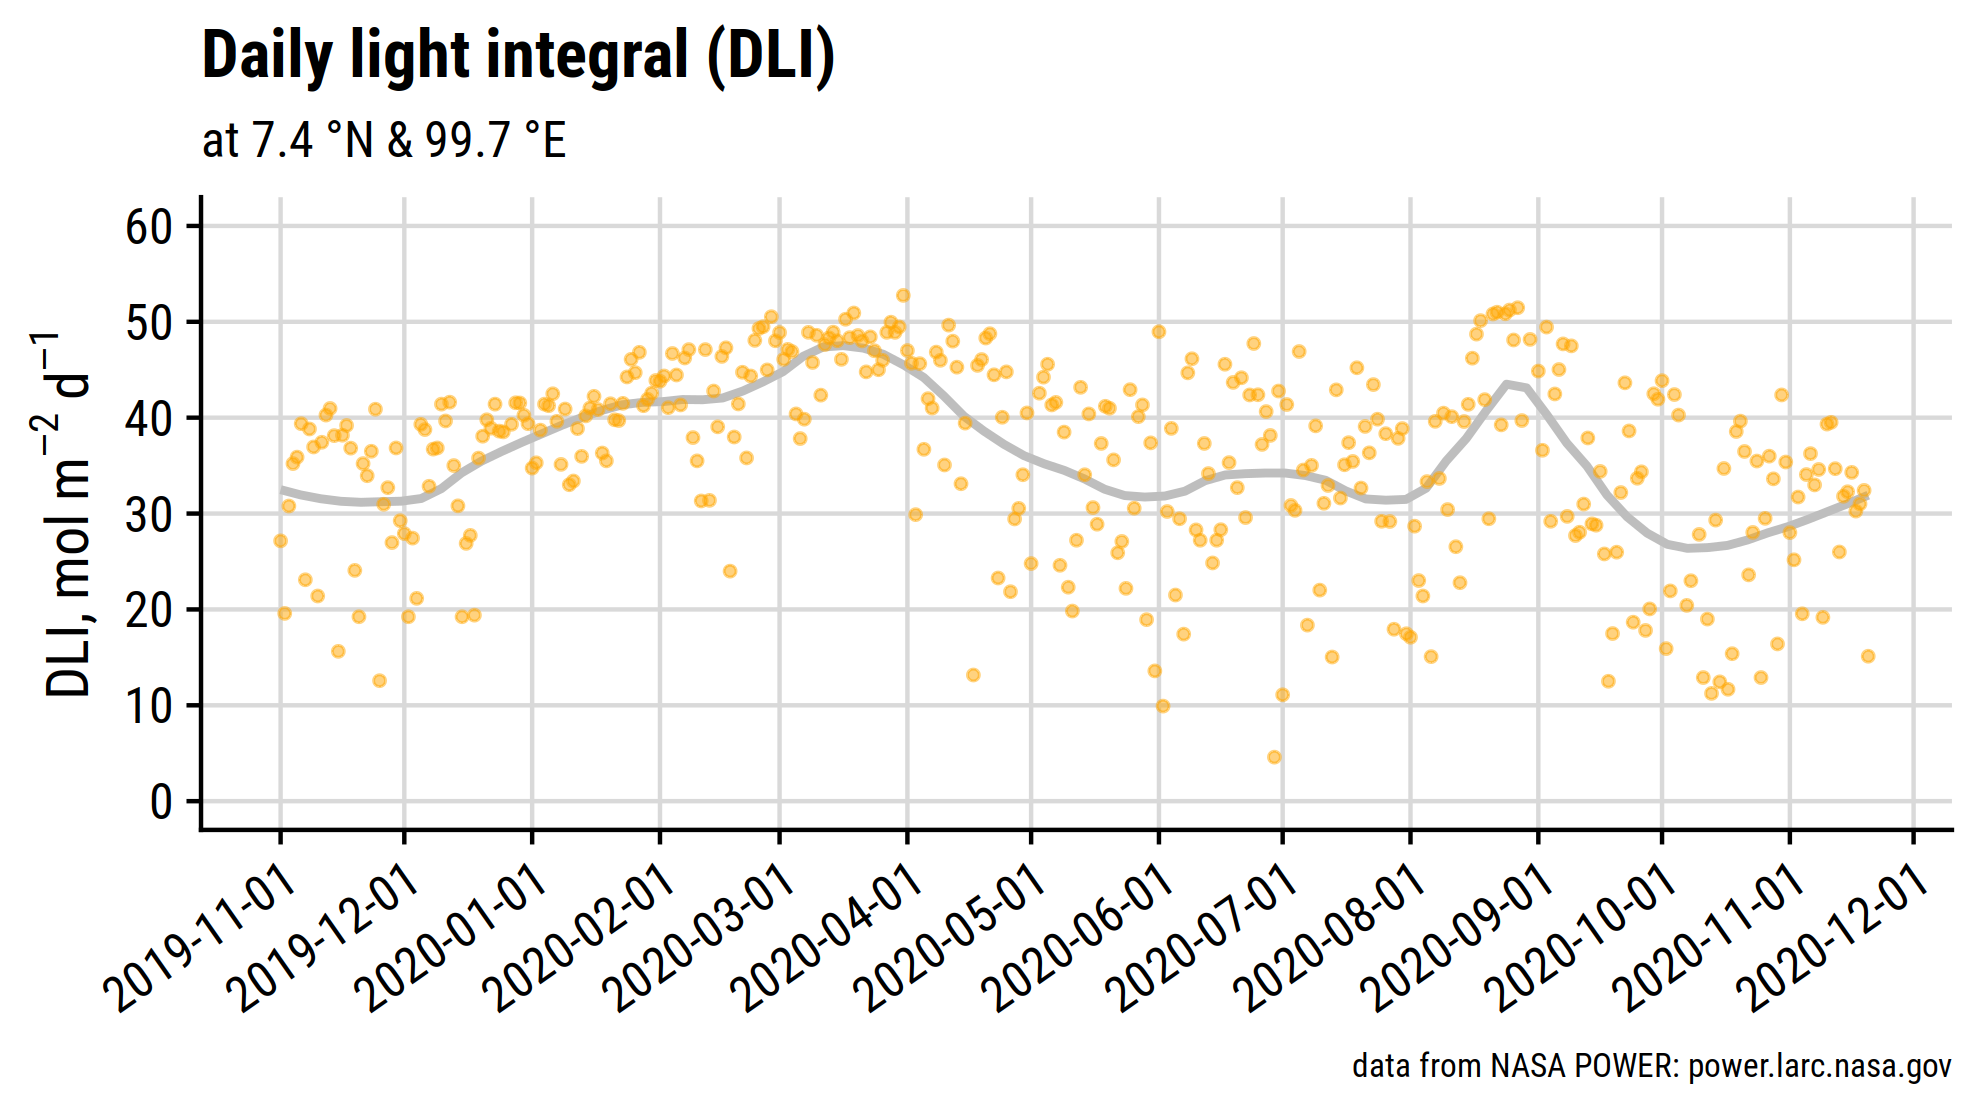
Here is a year and 3 weeks of photosynthetically active radiation (PAR), expressed in units of daily light integral (DLI). I get this by taking the POWER parameter All Sky Insolation Incident on a Horizontal Surface (Rs) and converting it to DLI by multiplying by 2.04 (see Meek et al., 1984 for more about this conversion).
The data are fascinating on their own, and are especially so when they can be used to understand or predict what happens with turfgrass.
This is ‘Wana’ manilagrass grown in full sun near Bangkok.
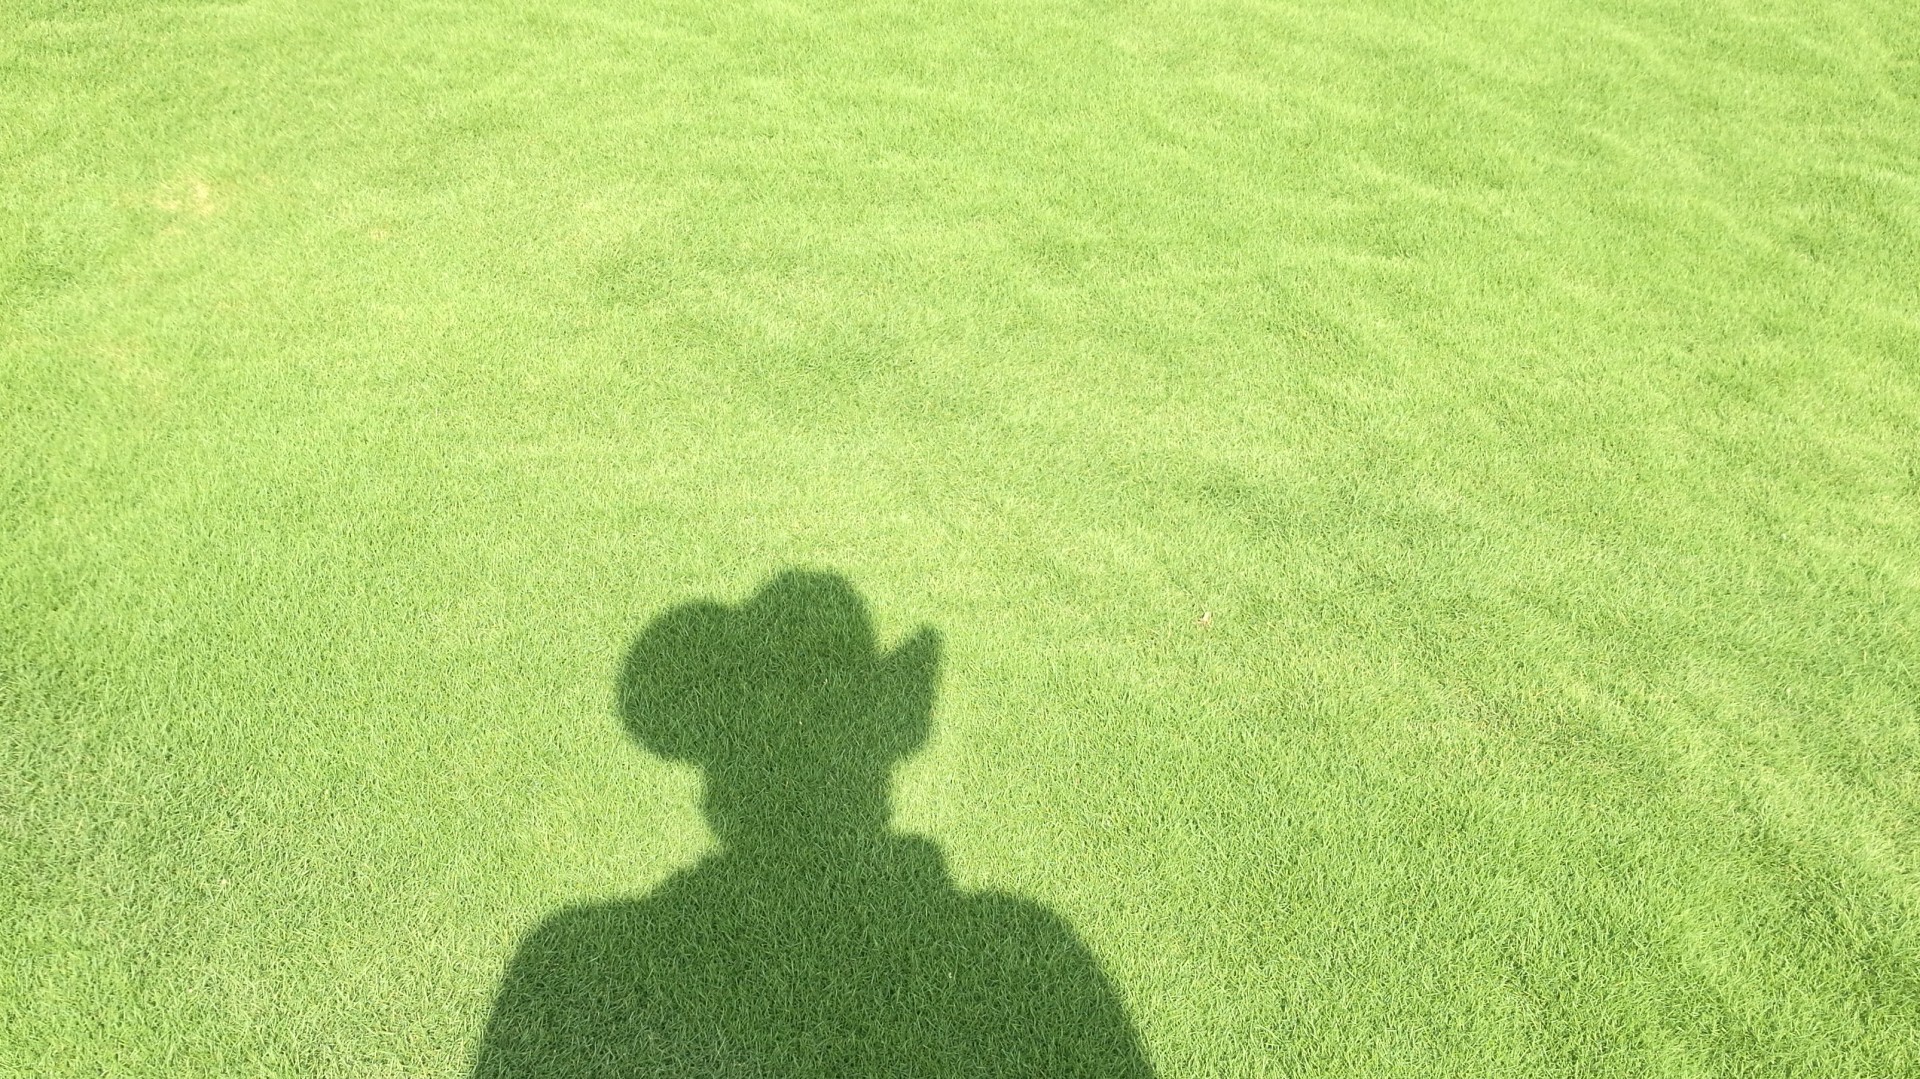
The mean DLI at this location over the past 4 months was 34 mol m-2 d-1. I’ve suggested previously that based on long-term turfgrass performance, “no-problem” DLI thresholds for grasses at putting green mowing height are 20 for manilagrass (Zoysia matrella), 30 for seashore paspalum (Paspalum vaginatum), and 40 for hybrid bermudagrass (Cynodon dactylon x C. transvaalensis). This is not a putting green, but the turf performance in full sun shows that a recent average DLI of 34 is plenty for this grass.
I also have ‘Wana’ growing at ATC南店. And the mean DLI (in full sun) for the past 4 months here has been 33 mol m-2 d-1. But the grass here is on my front steps, on the west side of a building. It is in 50% shade. The DLI where the grass sits is closer to 16. And the density of the turf shows the response to shade. Wana is in color.
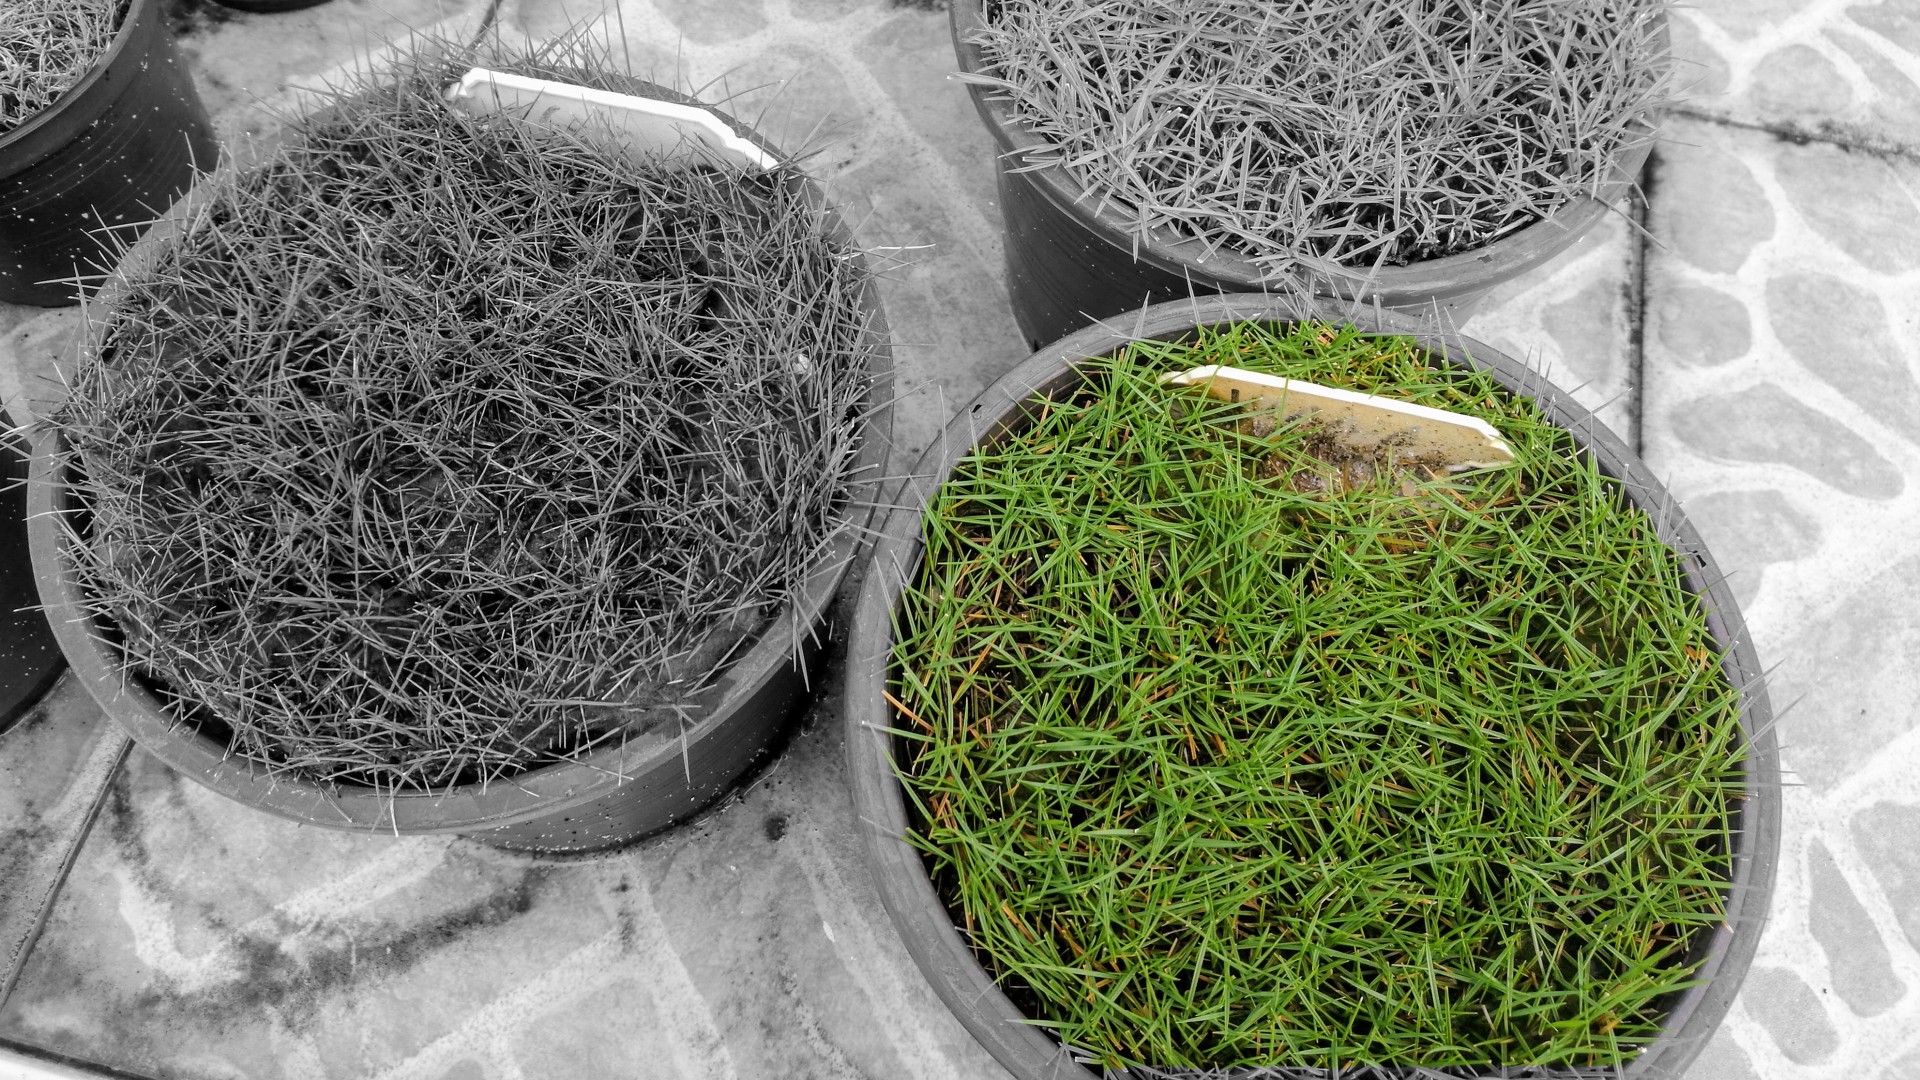
Not bad for 50% shade at the end of the rainy season. But not the same density this grass would have with just a little bit more PAR.