This post takes a few minutes to read because it covers this topic in a bit of detail. The summary is, I make use of two types of soil organic matter tests for turfgrass, these tests measure two different things, both important, and I recommend turfgrass managers measure both of these, ideally once a year.
To begin
I’ve written and talked a lot about #OM246 testing over the past couple of years. This may bring back some OM246 memories for anyone who spoke with me at Pebble Beach last year!
#Breakfastofchampions #USOpenAgronomy @asianturfgrass @SnickersIceCrm pic.twitter.com/BVc9jOgjMm
— Akoni Ganir, PCA (@AkoniGanir) June 12, 2019
Something that I’ve tried to make very clear is that the organic matter value reported on a standard soil nutrient test doesn’t include any of the thatch or mat or undecomposed plant material. All that is screened off and discarded before the soil is tested for organic matter.
It occurred to me, after I wrote about this again last week, that people might think I’m advocating for one test method instead of the other. That’s not what I’ve been trying to explain.
I make use of two types of soil organic matter tests. One is the standard test, of humus, that excludes the undecomposed material. Another is the total organic matter test (the OM246 test), that includes the undecomposed material.
For agriculture, I don’t think there is much use in measuring total organic matter. But for turfgrass, which often is treated with sand topdressing or cultivation or biostimulants intended to adjust the amount of undecomposed organic matter near the soil surface, it seems there is tremendous value in measuring all the organic matter too.
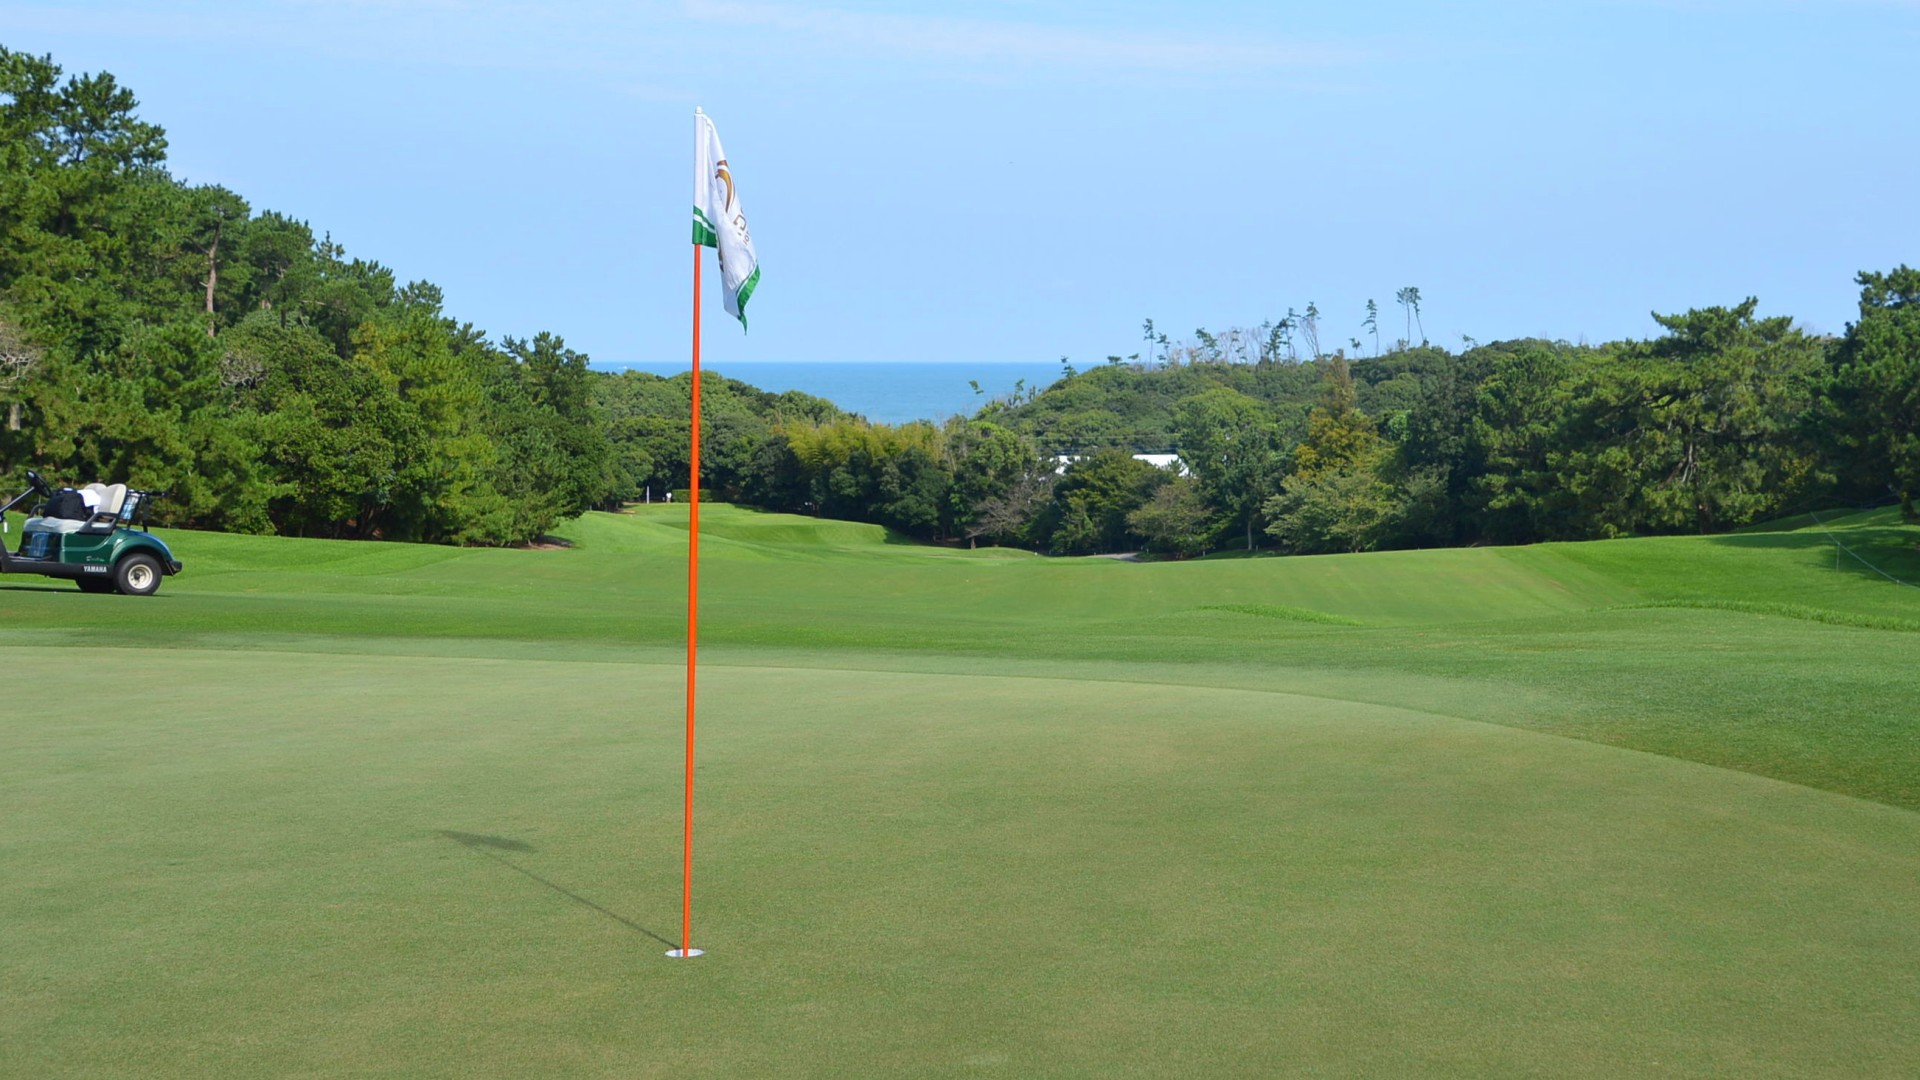 Looking from the 11th green at Keya GC toward the tee and the Genkai-nada Sea in the background.
Here are five distinct ways that I make use of these two tests. I happen to have a lot of tests from a photogenic green, the 11th at Keya GC in Fukuoka, Japan, and all the example data shown here are from that green.
This is a tale of two tests.
Organic matter (humus) and relative water and nutrient supply
This is the number you get from what is typically a mass loss on ignition (LOI) test done as part of a standard soil nutrient analysis. It’s usually going to be less than 2% — that’s 20 g of organic matter per kg of soil — on sand-based putting green rootzones. These are the past four years of the organic matter from the 11th green. This is for samples taken to a 10 cm depth, and passed through a 2 mm sieve.
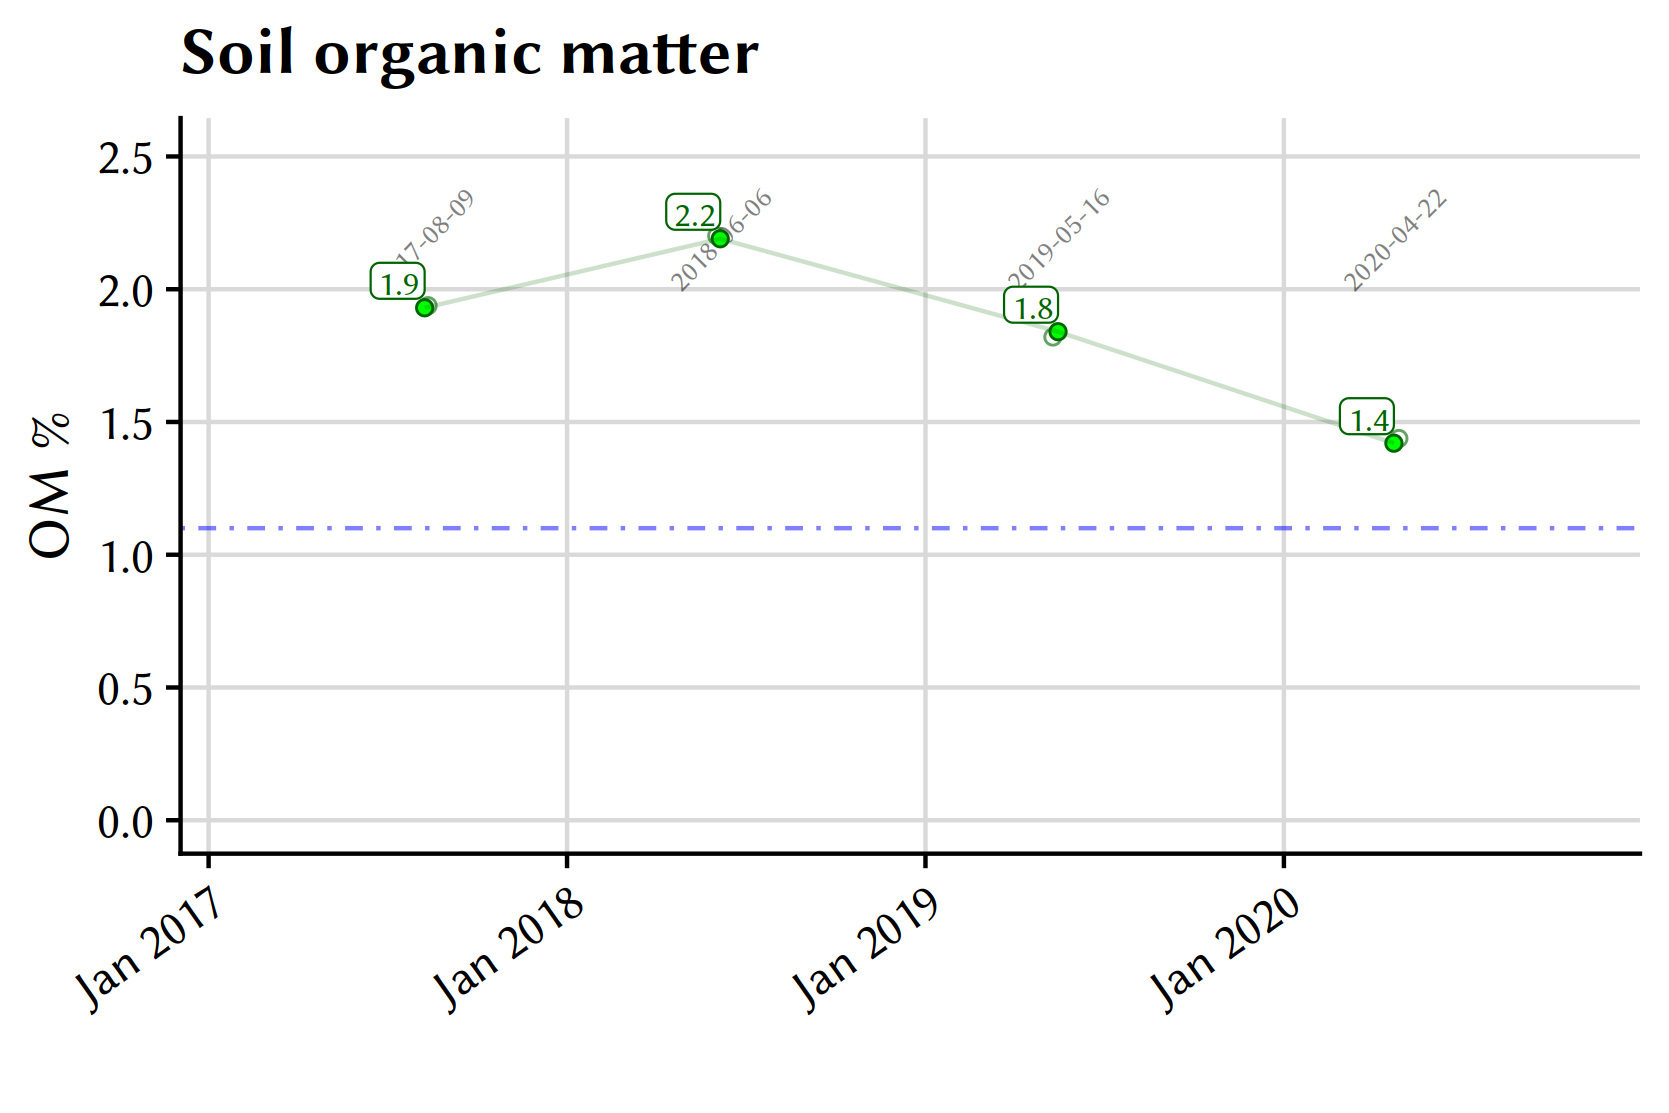
The most recent test was 1.4%. The average for putting greens in the ATC dataset is about 1.1%. So these are a little above average for putting greens.
And I think that is good, because this measure of organic matter is an indicator of the soil’s water and nutrient holding (or supplying) capacity. In relative terms, this green should be a little bit above average in this regard.
 View of the uphill par four 11th hole at Keya GC from the tee in early autumn 2020 after a bunker renovation project by Paul Jansen with shaping led by Keith Cutten. Photo by Keya’s golf course superintendent and assistant general manager, Andrew McDaniel.
Cation exchange capacity
In a sand rootzone, unless you’ve got some amendments like zeolite in them, or a bit of clay, the cation exchange capacity comes from pH-dependent charge on the soil organic matter. Sand is inert.
The contribution of organic matter to a soil’s cation exchange capacity (see Helling et al., 1964 for details) can be calculated by this equation:
\[CEC_{OM} = (\frac{OM}{100})(-311 + 268(pH))\]where
\(CEC_{OM}\) is the CEC contributed by soil organic matter, in units of mmolc kg-1. The little “c” subscript stands for “charge.” So it is millimoles of (negative) charge per kg of soil.
\(OM\) is the soil organic matter %
\(pH\) is the soil pH in 1:1 H20
What was the contribution of organic matter to the CEC of this green, then, with data from the most recent test? Organic matter was 1.4% and the pH was 6.5. That’s 20 mmolc kg-1.
That’s pretty good. To put that into context, nutrients in the soil at the MLSN guideline levels for Ca, Mg, and K have a CEC of 22 mmolc kg-1. There’s almost enough organic matter in this green to have those nutrient cations at the MLSN minimum level, even with nothing else in the soil providing a single negative charge.
If you’ve been paying attention to MLSN over the past eight years, you may have wondered what’s wrong with the conventional SLAN guidelines, that would have us introduce completely new guidelines? Well, CEC of sand rootzones is one. The SLAN minimums for Ca, Mg, and K in sand rootzones are given as 751, 121, and 117 mg/kg. When a sand rootzone tests lower than that, the SLAN interpretation is “approximately a 50% chance of getting a plant growth response from application of the nutrient; if supplemental fertilizer is not applied, growth will probably be limited, especially as the season progresses.” In a sand rootzone, it’s almost impossible to have a CEC high enough to hold that many nutrients. Those values correspond to a CEC of 50 mmolc kg-1.
Nitrogen mineralization, annually
Nitrogen mineralization from soil organic matter can be estimated from these general relationships.
Soil organic matter is about 5% nitrogen (and it’s about 58% carbon). From 1 to 4% of the soil’s organic matter will be mineralized each year. I usually take 2.5% as my estimate—right in the middle of that 1 to 4% range.
With 1.4% organic matter on the 11th green, I will convert it first into mass of organic matter per square meter. With a bulk density of 1.5 g cm-3 the 10 cm deep rootzone has a mass of 150 kg per square meter. The soil test says 1.4% of that is organic matter. That’s 2.1 kg of organic matter in each square meter.
We can expect that 5% of that organic matter is N, so that is 105 g of N per square meter (that’s 21 pounds of N per 1,000 ft2). How much of that N is expected to be mineralized, so that the grass can use it, each year? I’m taking as a point estimate 2.5% of that, so it comes to be 2.6 g N m-2 yr-1 (half a pound per 1000 ft2). But there is a pretty wide range, remember, expecting from 1 to 4% of the organic matter will be mineralized, so it’s really a range of 1.1 to 4.2 g N m-2 yr-1.
Depending where you are in the world, or what type of grass you are growing, or how much N you apply, that might be negligible, or it might be substantial. In the case of the korai greens at Keya, that’s about 20 to 25% of the N applied in a year.
Nitrogen mineralization, monthly
Knowing the expected total amount of N mineralization is useful, and all one needs is the soil organic matter number to estimate that. But it’s a slug of N, with some expectation that the majority of it will be mineralized at the hottest times of the year, but not really apportioned over any particular time periods.
I find it useful to make some additional calculations, with temperature data from the site, to make site specific estimates of when the N will be mineralized. I make these calculations daily and then sum them to report monthly totals (using calculations based on those described by Gilmour and Mauromoustakos; for more about this interesting topic, see my blog post Nitrogen, rain, and starting point estimates: estimating the N mineralization from soil organic matter based on temperature and soil water content)
When I make the calculations that way, using the 1.4% organic matter that was measured at Keya GC in samples collected in April 2020, and using daily temperature data for that location, and assuming that soil moisture on that green is kept on average at half of field capacity, then the calculations provide a nice estimate of both when and how much N will be mineralized at that location.
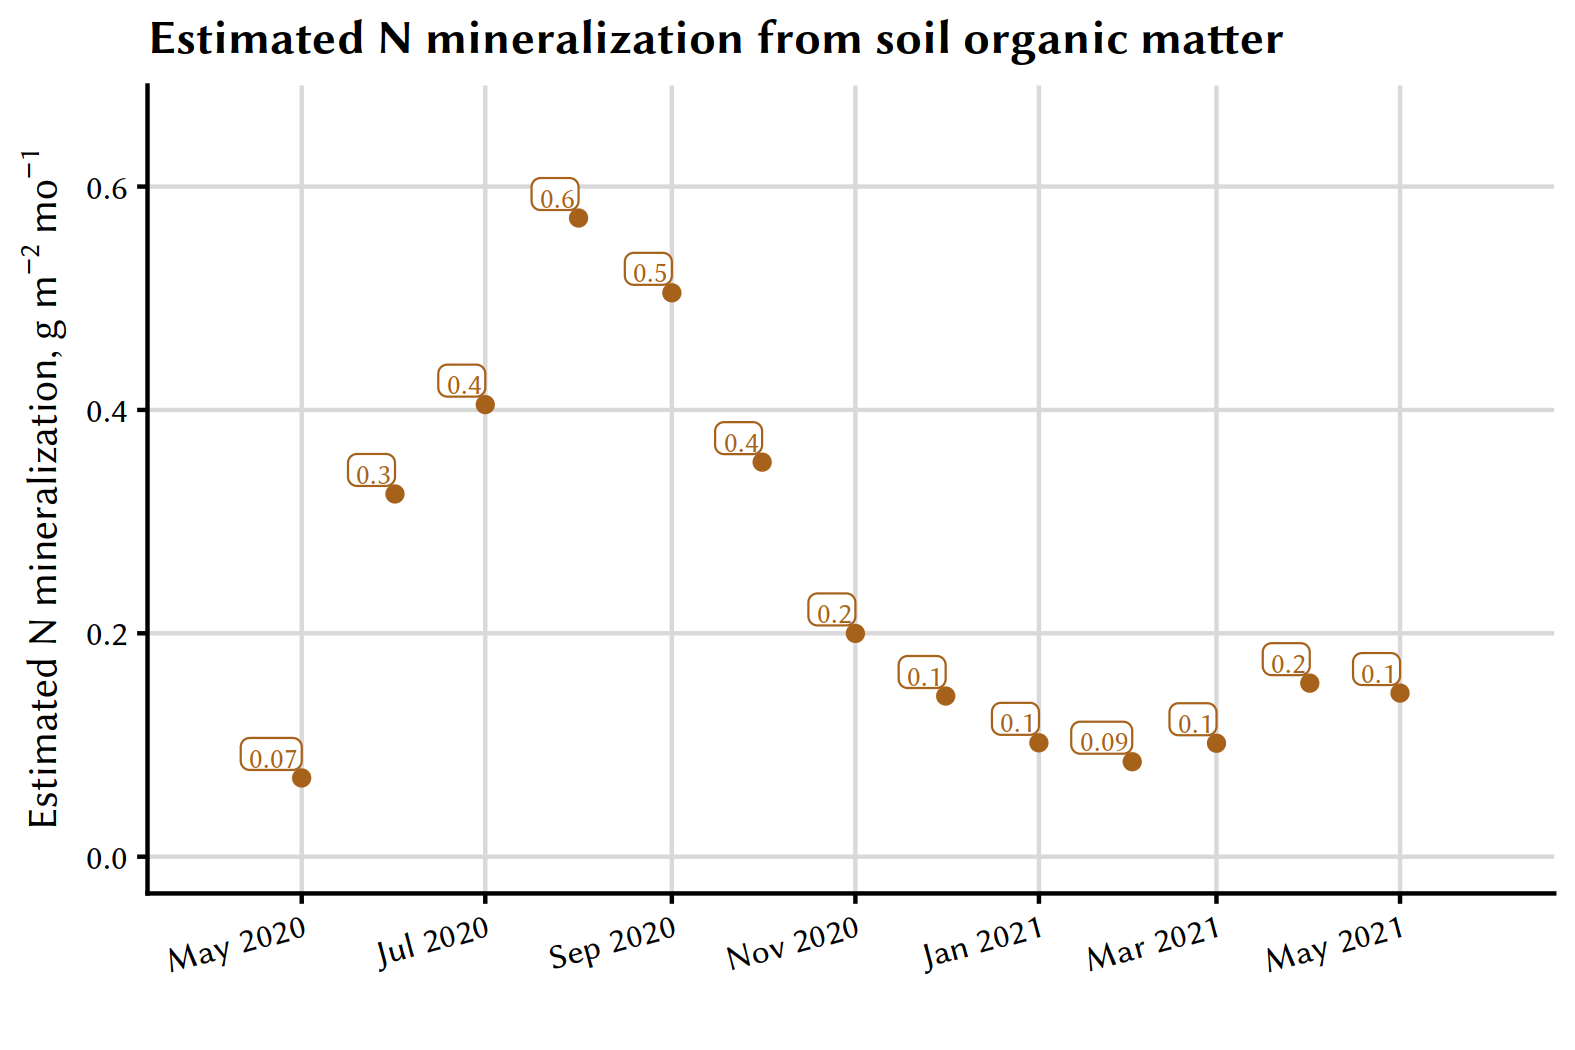
The lump sum annual estimate in the preceding section was 2.6 grams with a range from 1.1 to 4.2. The daily calculations here, summed over the year and shown by month, using local temperature data, come to 3.2 g. That’s right in the ballpark, isn’t it?
That pretty much exhausts what I use the standard soil organic matter for. I look at it for:
-
An assessment of the relative nutrient and water holding/supplying capacity of the soil.
-
I calculate the precise contribution of that quantity of OM to the soil’s CEC.
-
I look at a lump sum annual estimate of N mineralization.
-
I calculate a site specific prediction of N mineralization for the upcoming year.
An aside — there’s a lot of work done to adjust a different type of organic matter
There’s another type of organic matter that turfgrass managers do a ton of work to deal with. Call it thatch, or fiber, or total organic matter, or whatever—this is the material that all the scarifying, scalping, core removal, sand topdressing, sand injection, and so on is done to deal with.
The organic matter I’ve written about up to this point is not quite that. It is a portion of that total organic matter, but remember that all the thatch and plant material and fiber is screened off and discarded from soil samples before they are tested for organic matter.
If we are to make an assessment of the need for, or the effect of, disruptive maintence practices such as sand topdressing, core aeration, and scarifying, it makes sense to add on another test of organic matter. But this time, measure it only at some key depths near the soil surface, and most importantly, leave all the thatch and fiber and total organic matter in the sample. This is what I call OM246.
OM246, total organic matter by depth
Here’s the OM246 results for the 11th green.
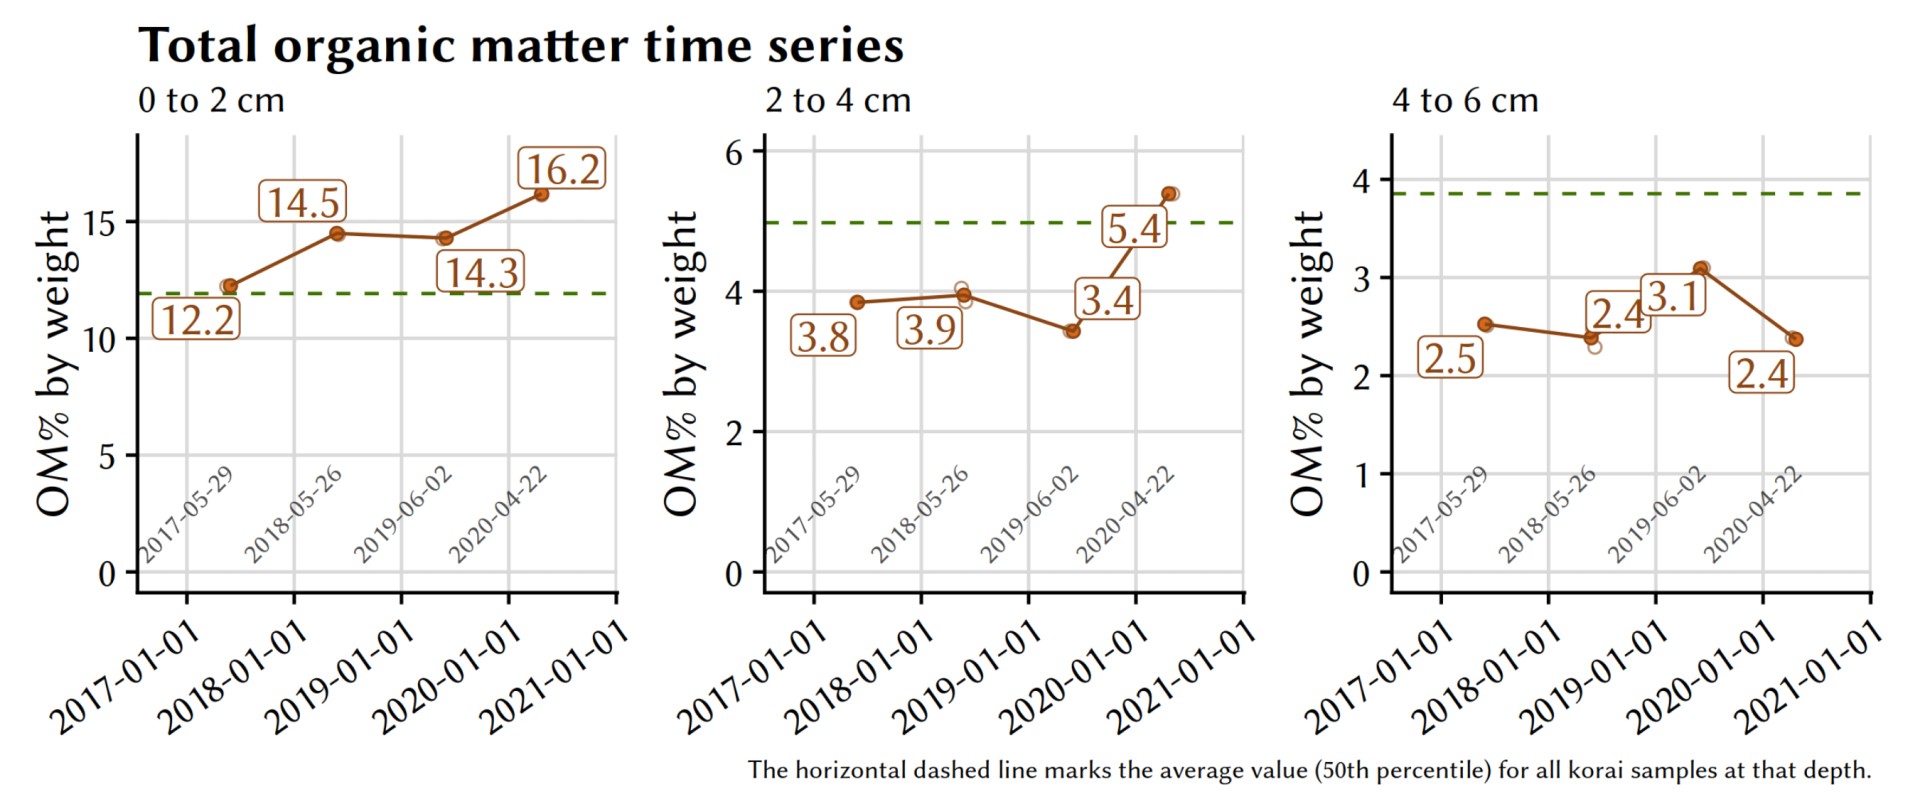
See how different those numbers are from the regular organic matter test result? There are two reasons for this. First, these samples are from specific depths right at the surface of the putting green. There is more organic matter closer to the soil surface than there is deeper in the soil profile. The standard soil test is a sample taken to a depth of 10 cm. The OM246 is samples at 0 to 2, 2 to 4, and 4 to 6 cm. That’s one reason. The second reason for higher organic matter is because these samples are tested at the lab as they are received. Everything that burns off as mass loss on ignition is reported. Nothing is screened and discarded. So we get the rhizomes, and the thatch, and the roots, and the stems, and the microbes, and the humus. In short, everything.
 Hole 11 at Keya GC during a practice round for the 2018 KBC Augusta Tournament.
The OM2 and the OM4 are going up on this green. The surface is still performing well. I’d like to see the OM2 keep flat at about 12% on this green, because for the professional tournament held the last week of August each year at this course, I think the surface firmness is easier to adjust to the desired level when the OM2 is at about 12%. Because of this, I’ve recommended application of a bit more topdressing sand.
I didn’t recommend coring, at least to the typical 7 cm depth. The test results for OM6 don’t show any organic matter accumulation at that depth (and for the standard organic matter tests, screened and to a 10 cm depth, you saw above that the OM was actually trending down to get to 1.4% this year). If OM is not accumulating below 4 cm, then I don’t think it is necessary to remove cores to that depth or to put clean sand to that depth. I do recommend trying to reduce the total organic matter right at the surface, and that means adding a bit more sand.
Summary
That’s it. Those are a couple tests, some logic, and a few equations that give an overview of how I make use of two types of soil organic matter tests for turfgrass. I used the data from the 11th green at Keya GC as an example. You can apply these sample calculations to your OM data to make informed decisions for your property.