The amount of nitrogen (N) supplied over a certain time duration, compared to a standard amount, is what I call the genki level (GL). And the amount of clippings harvested over a certain time duration, compared to a standard amount, is what Jason Haines calls the turfgrass speedo.
I wrote about those in these posts: turfgrass genki level part 1, part 2, and part 3.
In these posts, I’ve been working with monthly time durations.
What if one compares the genki level to the turfgrass speedo on a scatterplot? The result is an interesting comparison of how much the grass was supplied with N, plotted simultaneously with the actual growth, with both adjusted for the season of the year. That’s what I mean by a normalized comparison.
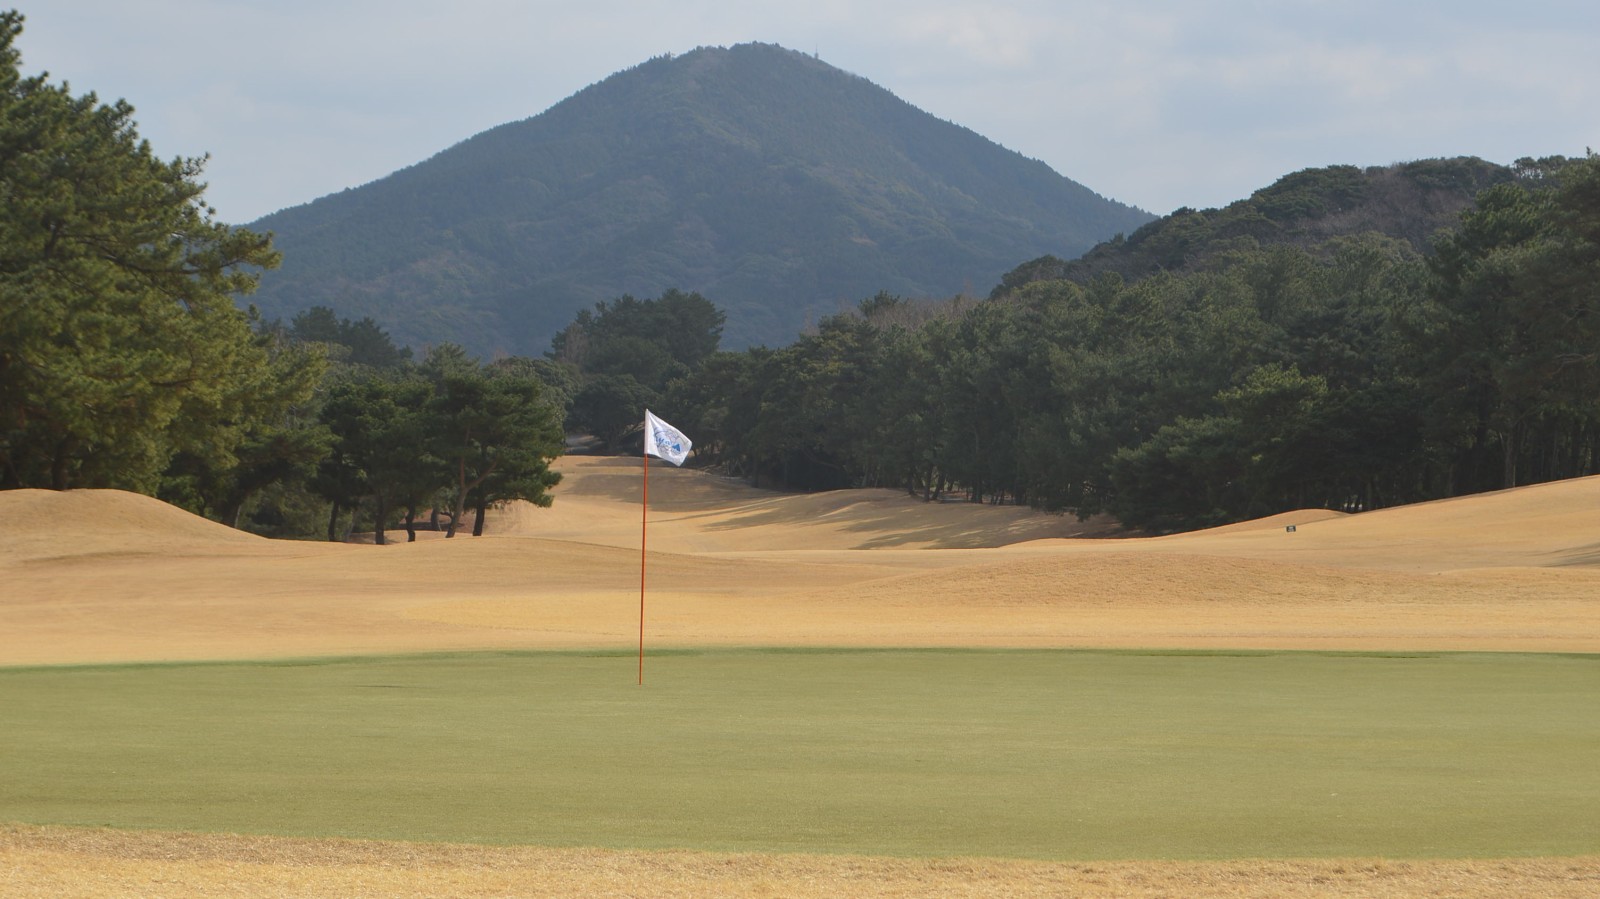
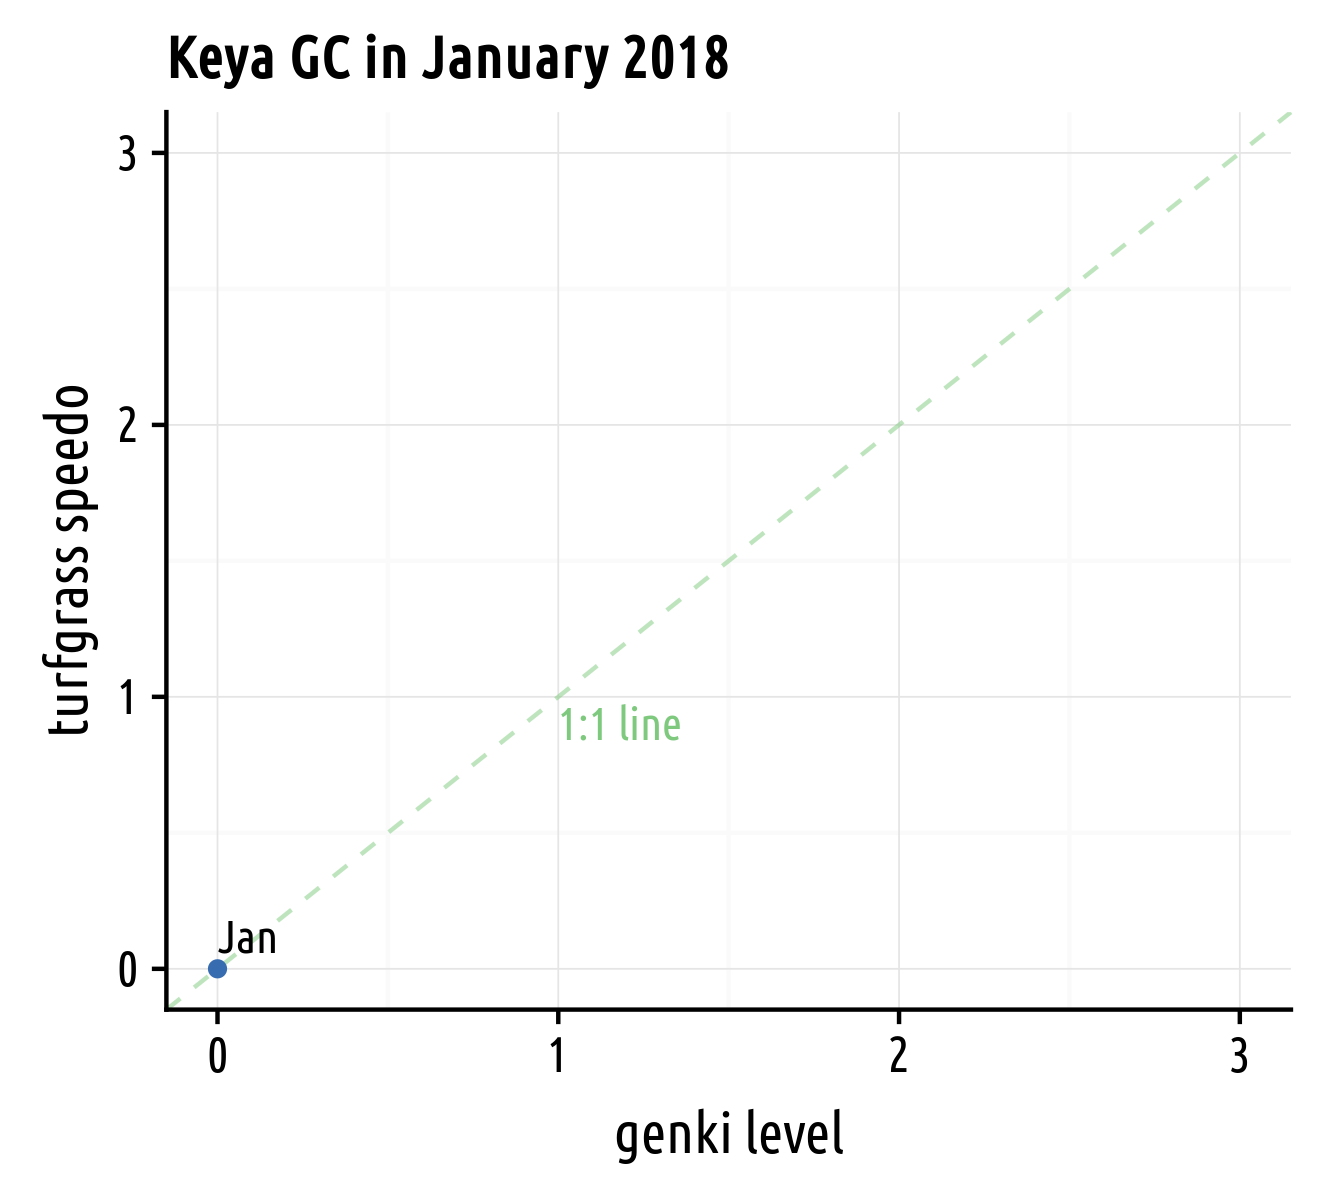
Let’s look at this for korai (Zoysia matrella) putting greens at Keya GC in Fukuoka, Japan. In the winter, this warm-season grass isn’t growing, and the clipping volume during January 2018 was 0, because the greens weren’t mown.
 Korai greens at Keya GC don’t grow in the winter; the clipping volume is 0.
When the clipping volume is 0, the turfgrass speedo is 0. And no N was applied in January 2018, so that gives a GL of 0 too.

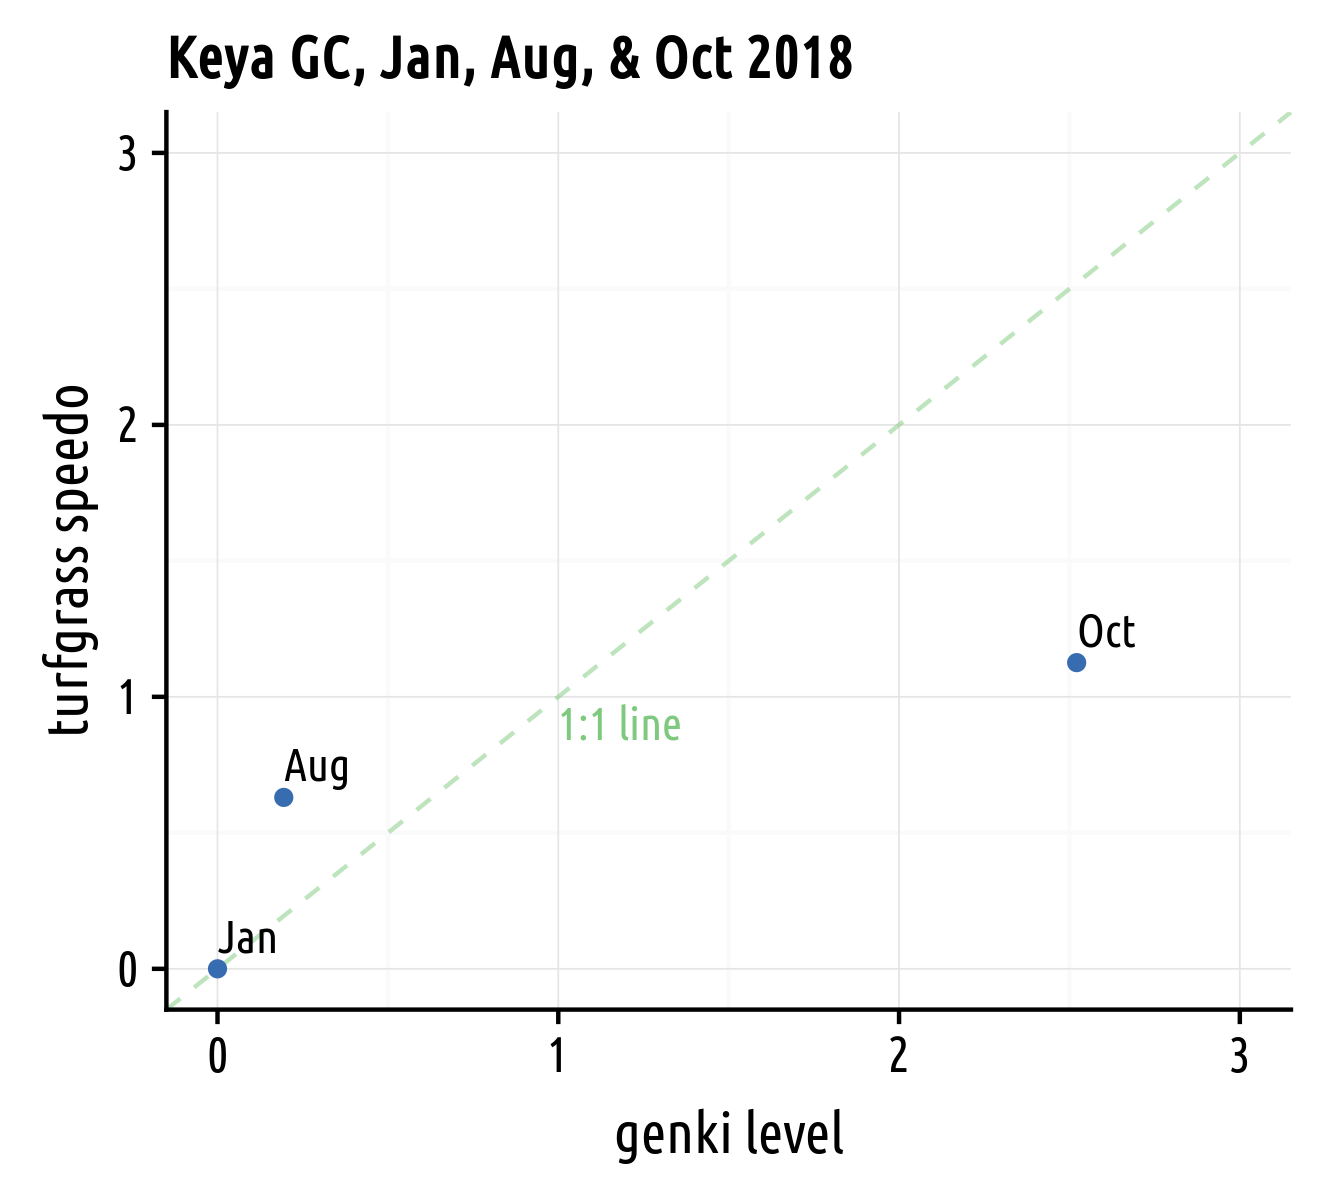
When the GL is the same as the speedo, the point will fall on the 1:1 line. What if the point would fall to the left of (or above) the 1:1 line? That means that the growth for that time duration is more than would have been expected, given the amount of N supplied. And if the point falls to the right of (or below) the 1:1 line? That means that one is pushing the grass with N fertilizer during that time duration but the growth response isn’t happening yet.
Here we can look at this for January, August, and October 2018.

In August, the point falls to the left of the 1:1 line, and in October, the point falls to the right of it. What’s going on here?
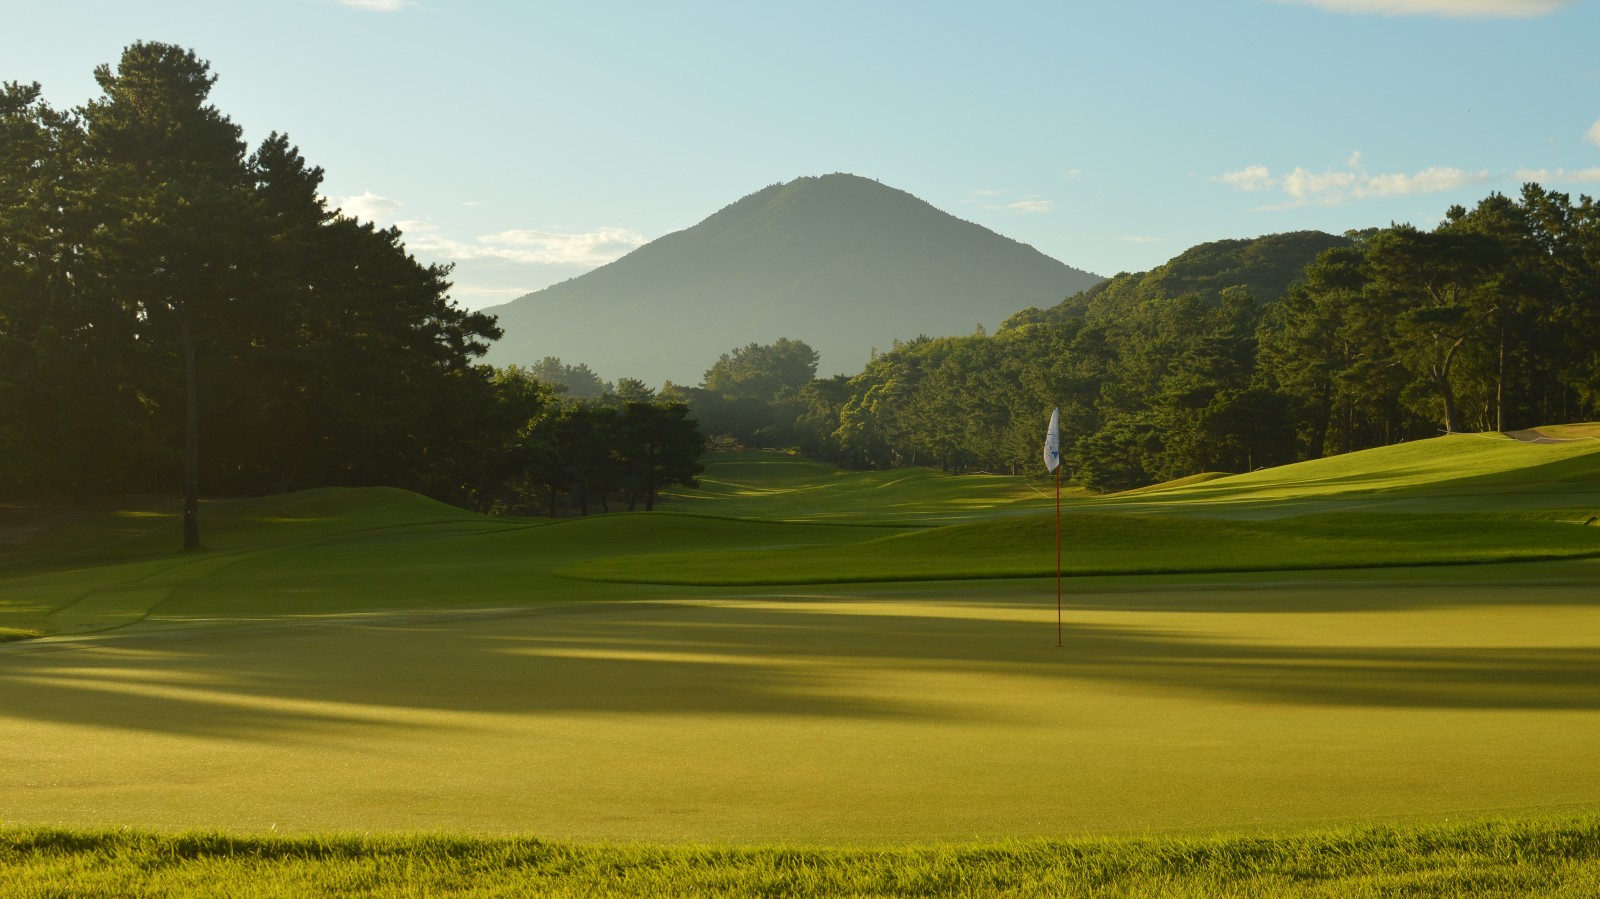
 The 18th green at Keya GC in August 2018. The turfgrass speedo was 0.63 during that month even though the GL was 0.19.
During August, the temperatures at Keya GC are hot, and there is a lot of N mineralization. In addition to that, warm-season grass grows a lot when the temperatures are hot. So the speedo is more than the GL.
But by October, the GL is now more than the speedo. That indicates that the grass is being pushed to grow but isn’t responding during that same time duration. The temperatures are getting cool in October; the growth of korai slows dramatically by October in Fukuoka but by supplying N the green color of the turf can be retained into the winter. Here are photos from Keya in October a couple years ago:
These Korai greens are ready to ride out the fall season into winter. #zoysiagreens 秋のコウライグリーン pic.twitter.com/jwO8VBMj9e
— Andrew McDaniel (@drumcturf) October 24, 2016
In the next charts, I show all the months in which the greens were mown, and I show also for Hazeltine National GC and for Van Tri GC. I’ve also normalized this in one more way; I’ve set the maximum growth for the speedo at 600 mL m-2 month-1 for all the locations.

I find this to be a useful way to think of, and to visualize, the turfgrass response to the N supplied. I also find this especially useful in comparing how grass is managed at different locations, and that’s another reason I’ve set the maximum N and the maximum growth at the same value for the speedo and GL calculations.
Is there any take-home message from this? I expect these things:
- if one is consistently to the left of the 1:1 line, either the soil is supplying plenty of N, or the grass is going to need more N sometime in the future
- if one is consistently to the right of the 1:1 line, you can probably cut back on the N applications
- if the speedo is almost always more than 1, I’d think about reducing N even further, restricting water supply, or increasing growth regulators
- if the speedo is almost always less than 1, I’d think about growing the grass a little more at some times of the year by doing the opposite of the items listed in point 3