Chapter 12 Clipping volume timelines
I made a chart20 to describe how I think of #ClipVol.21
This static version of the chart highlights a few of the things I look at. An animated version is at https://www.asianturfgrass.com/img/y2018.gif.
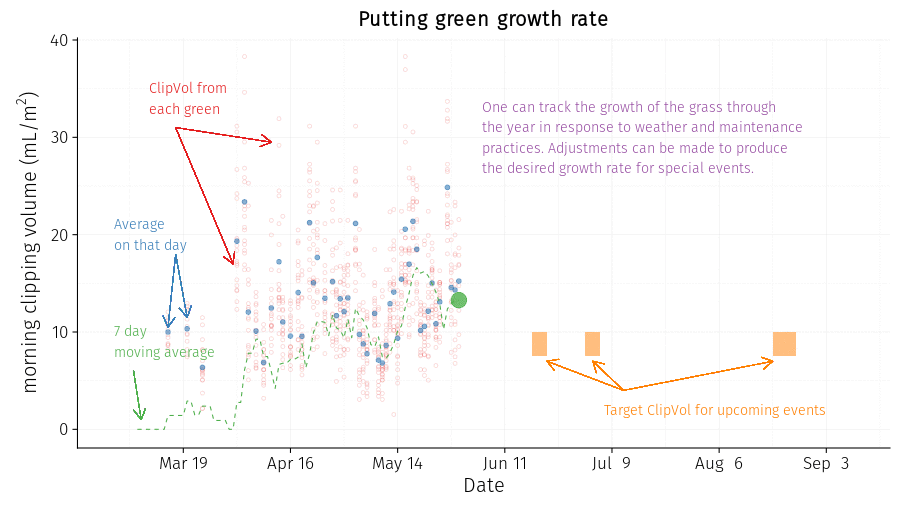
Annotated clipping volume chart with year-to-date clipping volume data as of early June
I’ll have some target growth rates for certain times of the year or for special events. I may also have some general targets for monthly and annual clipping volume. These targets will be based on previous measurements at my location.
I like to know the daily amounts and the variability from green to green. I look mostly at the daily average and may track the standard deviation among greens.
More than the daily amounts from any green, or the daily average of all measured areas, I like to look at a 5 day or 7 day moving average. For this average, I’ll see how it compares to any upcoming targets. I’ll also see if the slope (or trend) of the moving average is increasing or decreasing. Based on this, and a comparison to upcoming targets, and daily assessment of the grass conditions, I can make a lot of decisions about what maintenance work to do—or to not do—and how intensively to do certain works.
Early June 2018, that’s when I put the post on this topic together (https://www.asianturfgrass.com/2018-06-03-clipvol-animation-and-green-speed/). This chapter is a substantial revision of that post, but the chart is the same.↩
The #clipvol hashtag on Twitter (https://twitter.com/hashtag/ClipVol?src=hash) is a quick and easy way to see how turf managers are using this rapid measurement of turfgrass growth.↩